NOTE, this article is split into two parts.
The first part, the main body (5 500 words [includes text for charts and tables]), presents this analysis’s results.
The second part, supplemental information and documentation (3 000 words [includes text for charts), lists data sources, describes methods, abbreviations, acronyms, and some of the terms used in this article.
This analysis is a snapshot of Light Tight Oil (LTO) extraction in the Bakken in North Dakota (ND) treated as one big project with actual data starting in Jan-09 and a cut-off Dec-20.
…
Proven reliable methods on the Estimated Ultimate Recovery (EUR) for any well (or for the average well of specified vintage populations, plays, fields, companies, or other) is crucial to make estimates on remaining Proven Developed Producing (PDP) and Proven UnDeveloped (PUD) reserves which are the linchpins for assets backed lending (reserves-based lending).
EUR assessments based on realistic decline curves are the foundations for realistic forecasts on future cash flows, which form the basis for the companies’ financial planning, inclusive CAPital EXpenditures (CAPEX) for future well additions, and gatherings and processing systems.
Reserves-based lending is what the companies depend on to leverage their equities, inclusive owners’ capital for loans that together set the pace for developments of their acreage. These loans often come with clauses about the speed for drilling the companies’ area as the lenders want to see their capital returned with a profit within an agreed time frame. These loans come with covenants of various scopes commonly described by financial metrics, which the borrowers have accepted to honor.
In this article, I will focus on PDP reserves as there is more uncertainty associated with developments of PUDs in time, price, and cost.
This Bakken article uses the same comprehensive and granular analysis of the average EUR by vintage and developments for PDP reserves and R/P for the Bakken presented in the article Bakken, Something About EURs, PDP Reserves and R over P Ratio in January 2020.

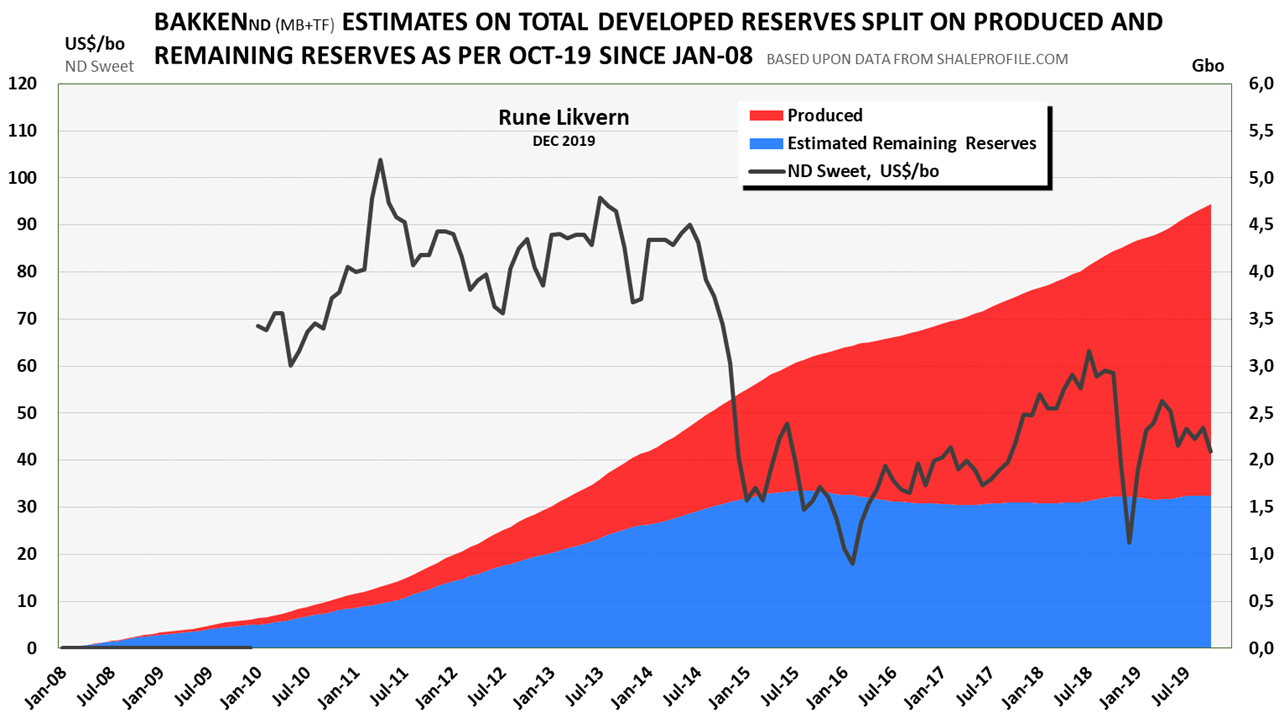
NOTE; the chart in figure 1 shows an estimate (red area) on the development of total capital employed (equity and borrowed) (from Jan-09 to Dec-20) for the manufacturing of wells that needs recovery before profits.
The high use of inorganic funding in 2020 is due to a combination of the collapse in the oil price and companies curtailing production to reduce costs and supplies as a contribution to rebalancing the market faster.
The chart does not give any indication about future profits or losses.
Apply caution from generally projecting results presented in this article on companies.
For public companies, the best insights are derived from their SEC filings, researching theirs well population’s actual performances (like over at Shaleprofile.com) and applying some alternative proven metrics derived from existing data.
The rapid build in the Bakken LTO extraction, refer to figure 3, came in two cycles, the first from early 2009 to early 2015, resulted from heavily outspending cash flows from operations. A considerable portion of it was debt. This massive inorganic funding boosted production and cash flows from operations. The second cycle started in early 2017 and ended in late 2019 was, to a lesser extent, inorganic funded.
The relative increase in the decline rates for younger vintages, see figures SD 02 and SD 06, explain why the companies must remain on the treadmill to bring in many new wells to sustain/grow the production. More importantly, sustain/build their PDP reserves, which are the significant component for reserves-based lending.
Continue reading “THE BAKKEN, A SNAPSHOT FROM 40 000 FEET AS OF END 2020”


You must be logged in to post a comment.