Proven reliable methods on the Estimated Ultimate Recovery (EUR) for any well (or other agreed parameter like EUR for the average well of specified vintage populations for plays, fields, companies or other) is crucial to make estimates on remaining Proven Developed Producing (PDP) and Proven UnDeveloped (PUD) reserves which are the linchpins for assets backed lending (reserves-based lending).
Attainable EURs with realistic decline curves are also the foundations for reasonable estimates on future cash flows, which forms the basis for the companies’ financial planning inclusive CAPital EXpenditures (CAPEX) for future well manufacturing.
Reserves-based lending is what the companies depend on to leverage their equities inclusive owners’ capital for loans that together sets the pace for developments of their acreage. These loans often come with clauses about the speed for the drilling of the companies’ area as the lenders want to see their capital returned with a profit within an agreed time frame. These loans come with covenants of various scopes commonly described by financial metrics which the borrowers have accepted to honor.
In this article, I will focus on PDP reserves as there is more uncertainty associated with developments of PUDs in time, price, and cost.
This article is based on a more comprehensive and granular analysis of the average EUR estimates by vintage and developments for PDP reserves and R/P for Bakken than what was presented in the article “The Bakken, a little about EUR and R/P” in August 2016.
A low R/P ratio (index) gives expectations of a steep decline in extraction from the growing population of wells, which results from Light Tight Oil (LTO) wells had steep and now steeper initial declines. The steeper declines also explain why the companies must stay on the treadmill to bring in a high number of new wells to sustain/grow the production and, more importantly, sustain/build their PDP reserves, which are the significant component for reserves-based lending.
- This study estimated remaining Proven Developed Producing (PDP) reserves in the Bakken(ND) as of end Oct-19 for the reference case to 1,6 – 1,7 Gbo (Giga, billion barrels).
The PDP reserves are from all the more than 14 000 horizontal wells started from Jan-08 and per Oct-19.
The EURs for the average well of the 2008 – 2019 vintages used in this study are shown in figure SD 6 at the end of this article. - As of the end of Oct-19, the R/P (for Bakken, ND) was estimated at 3,3 (reference case).
A sensitivity analysis adding 5% to EURs for the 2015 – 2019 average vintage wells increase the R/P to 3,5. - This study Juxtaposed the PDP estimates with the PDP numbers from the SEC 10-K filings for 2018 for some public companies that are heavily exposed to the Bakken (more than 90% of their equity/entitlement production from the Bakken).
At the end of 2018, this study found that these companies’ SEC reported PDP reserves were overstated with 30% – 50%. - An independent verification confirming overstated reserves would, for those affected, likely result in a downgrade of their credit rating. A downgrade to below investment grade would have far-reaching consequences as any institutional investors would be forced to sell their bonds into a liquid starved junk bond market, and the companies would be faced with much higher interest rates for debt that is rolled over which eats into their cash flows.
- Should several independent and seasoned third parties verify the magnitude of overstated reserves, several LTO companies would be cornered, and the only way to paper over this would be to sweat it out while praying for a significant lasting higher oil price (like $90/bo or higher) soon.
Cornered because any sale of a significant portion of their well portfolio to buyers that have done their due diligence based on actual well data could come up with a much different assessment from the seller’s reserves and asked price based on the seller’s booked value of the portfolio for sale. A realized sale of a significant portion of the well portfolio reflecting the buyer’s offer could highlight that the seller’s booked to model PDP reserves is much lower. A realized sale could force the seller to take considerable impairments, which subsequently would raise questions about the remaining PDP reserves on their books. And as the PDP reserves of one or several companies become questioned, more would follow. - Based on the PDP reserves from this study, it was estimated that each barrel of oil in the ground was burdened with about $30/bo (includes revenues from natural gas) to recover employed capital.
Another way to put this is that each barrel of oil has to netback $30/bo at the wellhead, or gross about $55 – $60/bo at the wellhead to recover employed capital (owners’ capital and debt) and also pay for Plugging & Abandonment. The estimated $55 – $60/bo is to recover employed capital and thus leaves no profit.
Applying simple project economics to earn a return of 7% (for the Bakken as one big project) would require an oil price of $80/bo at the wellhead for the PDP reserves as of end Oct-19. - Management in many shale companies has a performance incentive structure in which production developments has been/is dominant.
- For the next 1-2 years, managements of LTO companies will generate and implement strategies that search to balance allocation of available capital to sustain and/or grow their production and reserve base (used for reserved based lending), deleverage and/or pay dividends to a growing number of impatient owners.
To exacerbate this challenge, the banks now have tightened requirements on revolving credit, decreased their loans, and voiced concern that the assets of some shale companies will not cover the loans. This is commonly referred to as balance sheet/accounting insolvency, and if the situation continues, creditors and lenders could force the company to sell assets or declare bankruptcy.
At present oil/gas prices this becomes exquisitely balancing acts as any financial deleveraging and dividend payouts eat into funds that otherwise could be made available for more well manufacturing. - Reducing CAPEX for well manufacturing below some threshold to generate some Free Cash Flow (FCF) comes with some catches, and this is not only from the prospects from a decline in production/extraction and thus operational cash flow.
Changes to the Reserves Replacement Ratio (RRR) is an important parameter to follow and how it affects PDP reserves. Many companies have relied heavily on reserves-based lending, and a significant decline in PDP reserves will, by default, increase financial leverage and may (stress) test some of the loan covenants. - Covenant light loans give less protection for investors. Credit rating agencies flagged problems with these for years, and issues with leveraged loans can happen overnight as it is challenging to see stress building on balance sheets from inflated (oil and gas) reserves estimates.
Realistic EURs and R/P estimates (produced by competent and independent third parties) could become a real game-changer for the future pace of US LTO developments. - In recent years I have come to use the global credit impulse as one of the major leading indicators to predict the band of the oil price one year forward. Back in August 2018, I used the global credit impulse (amongst several other indicators like supply and demand, storage, etc.) to predict the oil price one year forward.
As of now and for 2020, few things suggest the global credit impulse will give support for a material higher oil price. Then throw in the US presidential election in 2020, which now makes me extend my price band of $55 – $70/bo from late 2018 for Brent Spot for this year.
OPEC+ may cut more to supplies to shore up the oil price, but OPEC+ has no control over changes to the global credit impulse, the future strengths/weaknesses to the US$, and developments in affordability amongst the global consumers.
In 2019 an average oil price in the mid-’60s (Brent Spot) triggered protests amongst consumers in several economies. There is a limit to how much higher the oil price for struggling US consumers can rise before it starts to affect consumption. The affordability threshold in recent years has declined with the higher and continued growth in total global debt.My expectations for the oil price for 2020 are in line with most other analysts, and if that comes true, LTO operators should not expect much financial relief from the oil price this year.
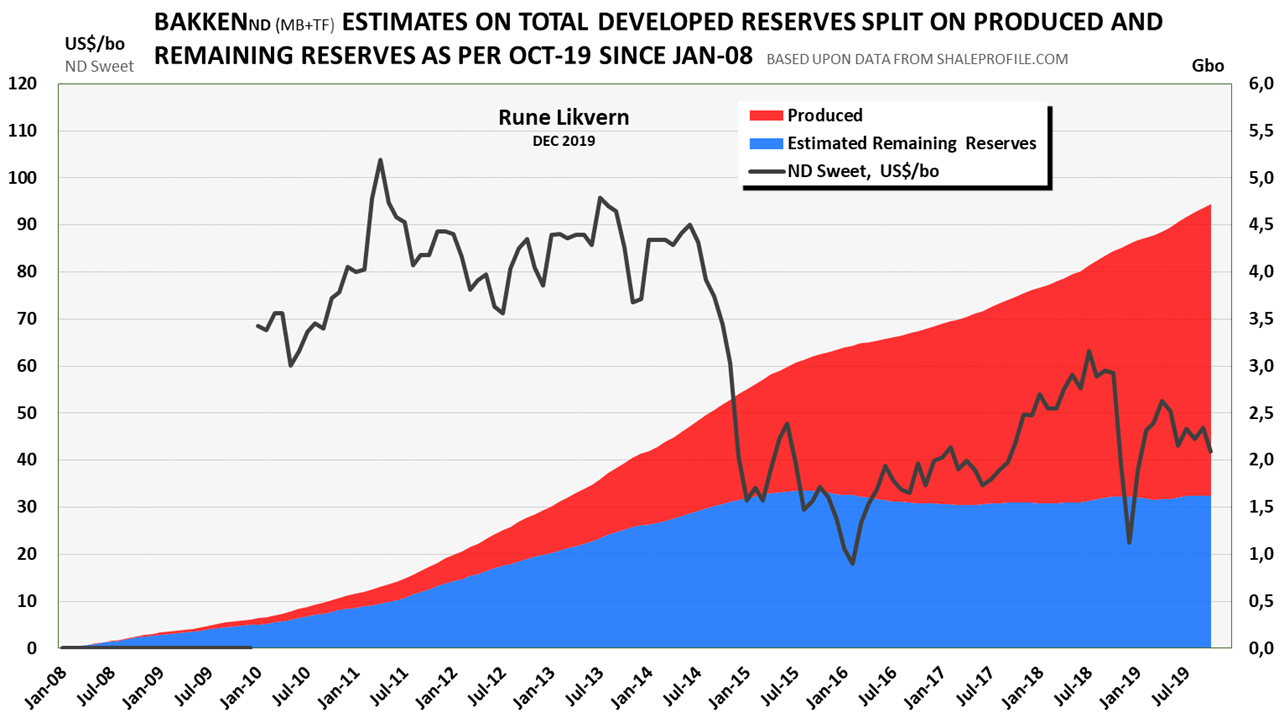
Figure 1 shows that since early 2015 and through the slow down till early 2017 and per Oct-19, the remaining Producing Developed Remaining Reserves (PDP) for the Bakken has remained almost flat. In other words, reserves were extracted/produced at about the same rate flowing wells were added.
LTO extraction grew from 0,92 Mbo/d in Jan-17 to 1,43 Mbo/d in Oct-19 or close to 60%.
In the same period, PDP reserves grew with an estimated 90 Mbo or about 6%.
What if?
The steep declines in LTO extraction are widely documented. However, in the public domain, there has so far been less attention given to developments in PDP reserves. A slowdown in well manufacturing below some threshold will quickly manifest itself as a decline in extraction, but more importantly, a decrease in PDP reserves, which constitutes a significant portion of the LTO companies’ assets (and thus equity) which accounts for a dominant share of their assets based lending.
Below is the documentation for how this would have played out with the addition of no wells in the Bakken post Oct-18.

With no wells added post Oct-18, the LTO extraction would have declined from 1,31 Mbo/d to 0,76 Mbo/d in Oct-19, or a decline of 42%. (NOTE, the numbers are from actual NDIC reported data.)
Such a steep decline quickly and severely impacts the cash flow and thus the ability to organically fund new wells.
The R/P ratio would, for some time, continue to decline, for then gradually grow towards 5 – 6 as the extraction level continues to decline. The remaining reserves last for longer with a lower extraction level. However, the above chart only shows a small portion of something more worrisome.

With no wells added post Oct-18, totally developed LTO reserves would remain flat while LTO PDP reserves (blue area) would decline as all extraction now came from the well population as of end Oct-18. For this “What If,” it was estimated that the PDP reserves would decline Year over Year (YoY) with more than 22% (from 1,61 Gbo to 1,25 Gbo). A YoY decline in PDP reserves of 22% has some severe impact on the assets side of the balance sheet. Using the (net) proceeds during this year to reduce the liabilities (US$ for US$), the equity would not be affected. That would be deleveraging and could position the company to take on more debt later. Here it is essential to keep in mind figure 2 as this deleveraging would significantly bring down the extraction level (42%), so it would take time (like 1-2 years if the company’s EUR’s and PDP reserves are closely reflected by what was derived from actual data) to bring total extraction back to the levels of Oct-18.
The above exercise is based on EURs, as presented in figure SD 6 in this article.
Based on some companies’ SEC reported PDP reserves and juxtaposing these with what to realistically expect from actual data (as of Oct-19) the situation is distressing as real state-reported data now supports estimates that some companies’ PDP reserves are overstated by 30% – 50% which makes both their reported SEC assets and equity numbers hugely inflated.
Overstated reserves change the balance sheet dynamics dramatically, which becomes reinforced by a SEC price deck for the oil price that was lowered by $8 – $10/bo from 2018 to 2019.
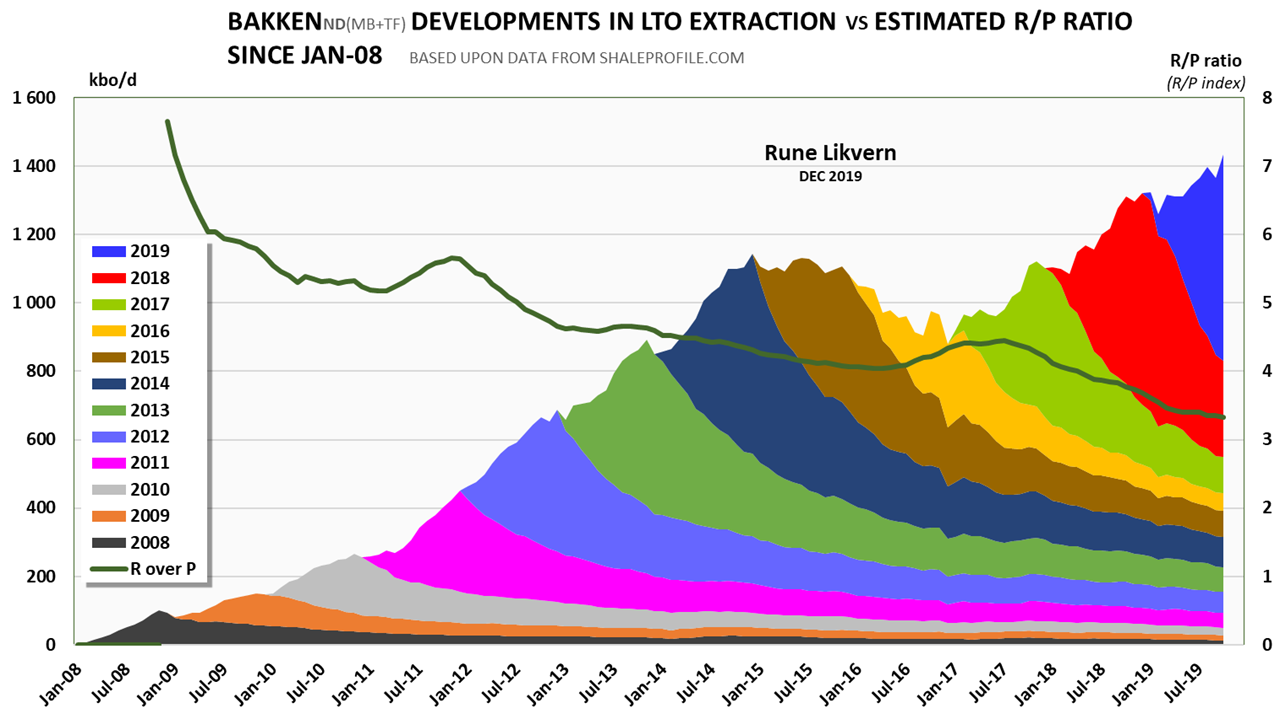
Note in the chart how the R/P ratio with some lag started to grow as extraction declined in late 2015.

The composite R/P shows how the 12-month rolling total (annualized) R/P developed since Jan-09 and per Oct-19. There is a spread both in the quality of the wells and the portfolio of wells in the different companies. Using the composite R/P should be considered a first iteration to evaluate companies’ anticipated PDP reserves.
For a company that had a portfolio that was close to a scaled version (like about 1:20) of the production developments and its well portion (at about 1:20) close to the average vintage wells of the Bakken, an R/P of about 3,7 should be expected to be derived from such a company’s SEC 10-K filing for 2018.
Figure 5 also illustrates that for companies with a portfolio of wells dominated by older vintages, a higher R/P in the range of 4,5 to 5,5 should be expected. Any R/P above six should prompt a more detailed analysis of the company’s well portfolio based on actual production data.
For those public companies with major exposure to the Bakken that I follow closely, I will illustrate my point by using a scaled version of a company which actual operational production development has been close to a “Bakken in scale.”
(The reason I have chosen to use a scaled version of the company is to anonymize the company as it is the financial dynamics that is important to understand.)
As of the end of 2018, this company’s R/P, based on their SEC 10-K reported PDP reserves, was about 6,3. Their ratio of long-term debt divided by (annual) cash flow from operations at the end of 2018 was about 2,7.
So far, so good.
What follows is a simplified illustration (with round numbers) to exemplify what impact the company’s inflated PDP reserves has on its balance sheet.
By applying EURs by vintage and PDP reserves derived from actual data (from Shaleprofile that collects data from NDIC) for this company, its R/P ratio was 3,5 at the end of 2018. This company’s PDP reserves become (3,5/6,3) * 100% = 55% of what is reported in their SEC filings.
From this “scaled” company’s balance sheet, it showed that about 80% of its assets were PDP reserves, 10% PUD reserves, and about 10% buildings and their shares of processing and transport facilities.
Total Assets: $4 000M
Total Liabilities: $2 000M
Total Stockholders’ Equity: $2 000M
Based on this study, the assessment of this company’s PDP reserves (at end 2018) should be 55% of $3 200M = $1 760M or $1 440M lower. The stockholders’ equity becomes reduced to $560M, which significantly increases its financial leverage and will test (or even breach) the loan covenants.
The SEC price deck for 2019 of $8 – $10/bo lower than in 2018 will further reduce the company’s assets and equity and make the company flirt with balance sheet insolvency at the end of 2019.
Balance sheet insolvency is a serious matter as it gets close to impossible for the company to sell more debt, and if it persists, creditors and lenders could force the company to sell assets or declare bankruptcy.
To put into some perspective, the importance of the R/P ratio; for 2017, the crude oil extraction from the Norwegian Continental Shelf (NCS) was about 1,59 Mbo/d resulting in an R/P ratio from producing fields of about 7 at end 2017.
In 2018 the NCS crude oil extraction from the fields in operation in 2017 dropped to 1,47 Mbo/d, or about 7%. This from fields with a composite R/P ratio of 7,0 at the end of 2017.
Compare this to the above scaled LTO company whose SEC reported PDP reserves at end 2018 resulted in an R/P ratio of 6,3 and whose production from wells in operation as of end 2018 dropped close to 50% during the first 10 months of 2019.
The reported massive drop in total extraction of 50% in 10 months (from actual data) is not to expect from a portfolio of PDP reserves that had an R/P ratio of 6,3 at the end of 2018.
Well Saturation in the Sweet Spots
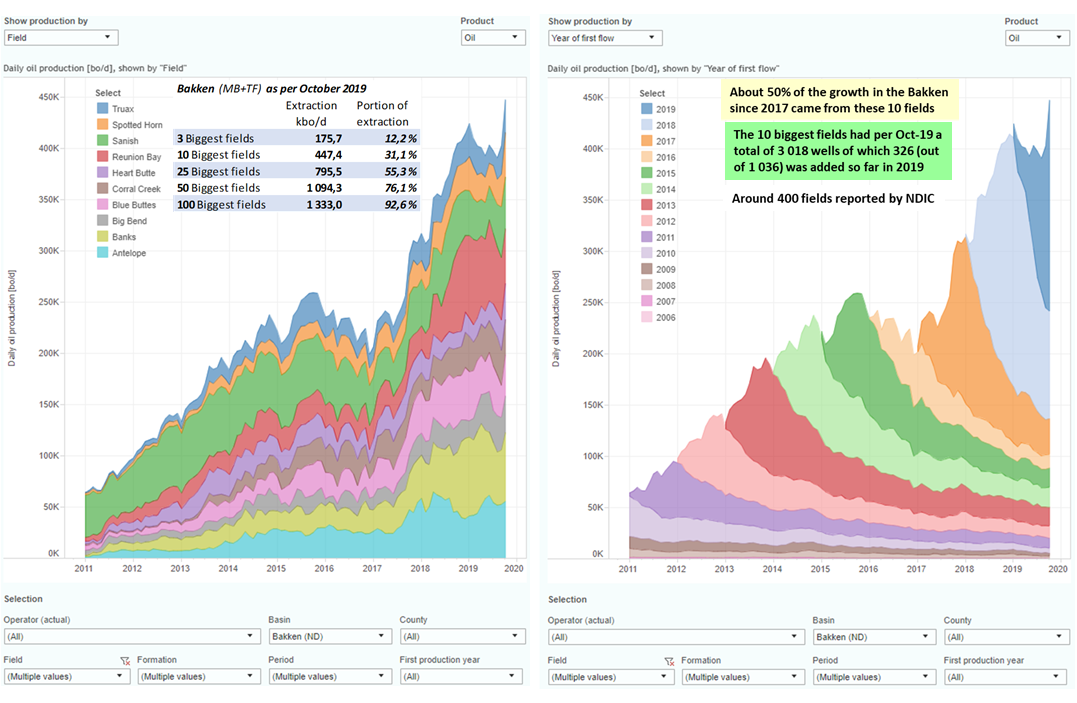
The right chart shows the extraction based on vintage from the same 10 fields.
(Charts from Shaleprofile.com.)
Several of the most prolific fields (like Banks, Reunion Bay and Sanish) has been drilled for more than a decade and are becoming saturated with wells. The Parshall field that started as the biggest was by Oct-19 down to number 14 of the biggest.
The list of the most significant fields is very fluid, and some of the fields lower down on the list will move upward and displace those now at the top 10 or 25 as more wells are started in these and as the old giants become saturated with wells and declines.
The fact that 25 of the most significant fields (of 400) stood for more than 55% of the LTO extraction in the Bakken in Oct-19 may also serve as a reminder that the inventory of undrilled wells in Tier 1 acreage is soon to be exhausted.

All wells had 23 months of reported flow and a minimum of 12 months of reported flow as of Oct-19. Data from NDIC via Shaleprofile.com.
The semi-log plot above is a powerful tool for assessments of EUR and has been and is still widely used within the extractive industries. As more production data are published and loaded into the chart, some changes are expected for the EUR trajectories as well as improved accuracy for the EUR.
The chart is a snapshot as per Oct-19, and the ranking amongst companies may change in the future. The graph illustrates that there is a distribution of the quality of the companies, and within each company, there is a distribution of the quality of their wells.
The chart shows that wells from ConocoPhillips, Marathon, and WPX are in a class by themselves.
Oasis is an interesting one, though its cumulative is higher than the average, the decline is much steeper, and its flow per Oct-19 was 97 bo/d compared to the average of 137 bo/d.
What is challenging to extract from companies SEC filings is if there are any cost differences for wells between companies with the best and those with the poorest wells.
For one company that had excellent first 12 months cumulative, it was derived from their SEC filings that their average well had cost $12 – $13 million (or more).
It was estimated (simple project economics) that the average 2017 vintage Bakken well will have a return of 3% – 5% with the oil price at $55 at the wellhead as from Dec-19. The companies inside the black line in figure 7 will likely have lower returns, and many will have to take cash write-downs in the future.
Most would describe projects returning 3% – 5% (based on simple project economics) as meager.
However, this changes if equity (owner’s capital) successfully is levered up with debt. For the same project, levered 7:2 (debt to equity) return on equity was estimated to be over 8%, which should be acceptable for the investors in a time with low interest rates and inflation.
Manufacturing Wells from Cash Flow from Operations (CFO)
Presented below is the results of a simplified exercise where the answer to the question; how would production developments for the Bakken be over the next 12 months if all (and only) the operational cash flow from the Bakken entirely became directed to the manufacturing of new wells inclusive 10 DUCs/month?
The initial condition was extraction as per Oct-19, new wells assumed to show an increase of 3% in their cumulative over the average 2018 vintage, resulting in a total of about 181 kbo after 12 months and with a wellhead price of $50/bo.

This exercise found that extraction would decline from 1,43 Mbo/d in Oct-19 to 1,33 Mbo/d in Oct-20 or a YoY decline of about 7%. Further, during these 12 months, about 500 Mbo would be extracted while about 400 Mbo became added from the additions of close to 1 000 wells. This exercise found that PDP reserves would decline by about 6%.
To sustain/grow extraction (move the blue line upwards) would require some inorganic funding (inorganic being funding above those from cash flow from operations), and possible sources (or combinations) thereof are from assets/equity sales and/or taking on more debt.
Using a portion of CFO towards deleveraging/returning money to the investors (as dividends) would reduce CAPEX for well manufacturing and could result in a steeper downward slope for the blue line.
Figure 7 shows that there is a big spread in the quality of the wells amongst the companies, and this may, over time, skew the portion of well manufacturing away from those with poorer wells to those with the best wells (or acreage). Those with the best wells and thus the best CFO may be able to organically grow their production while those with the more deficient wells will become constrained by available cash.
This exercise illustrates that growth in LTO extraction and reserves over the next year could require some of the funding to be inorganic (that is from other sources than CFO).
Companies with portfolios containing better than average wells will also have a better organic cash flow, which would allow them to manufacture more wells and continue to grow extraction. Companies with poorer wells would have to consider inorganic funding (debt, equity/assets sales) to grow extraction. Companies with poorer than average wells will have weaker balance sheets, which would constrain any growth ambitions.
This exercise was to provide some guidance about what it takes to grow production and reserves and give some explanations why the companies with the best acreage (wells) may manufacture a more significant portion of future wells.
SUPPLEMENTAL INFORMATION AND DOCUMENTATION
Data for this study comes from Shaleprofile.com and their article North Dakota – update through October 2019,
which presents data on the 14 300 horizontal wells started in the Bakken North Dakota as from Jan-08 and per Oct-19.
The economic analysis used a royalty of 18% and production and extraction taxes of 10%.
For Lease Operating Expenses (LOE), Marketing, transportation and gathering expenses, interest expenses, General and Administrative (G&A), and revenues from natural gas and NGL’s sales, a volume-weighted average derived from several public companies SEC 10-K/Q filings has been applied.
At the end of the economic life of the well are included costs for Plugging & Abandonment (P&A) of $150k – $200k.
For the economic analysis for Bakken as one project are costs for acreage not included. The costs of DUCs are covered with $3M – $4M/DUC.
For the economic analysis, the retirement of debt fulfilled as fast as CFO allowed (which may be conservative). Some of the costs like LOE, interest expenses (modeled to decline as debt is retired), G&A, marketing, transportation, and gathering are made volume dependent (their totals were modeled to have small volume elasticity over short time frames).
The post, including transportation and gathering, could prove challenging for companies that have booked capacities that they, over time, cannot fully utilize. Typically, transportation and gathering contracts for pipelines have “ship or pay” clauses, meaning that if the booked capacity becomes not fully used, the specific costs grow with the inverse of the utilization rate.
A company that has specific transportation and gathering costs of $5/bo when utilizing 100% of their booked capacity could find their specific transportation and gathering costs grow to ($5/0,6)/bo = $8,33/bo if their utilization rate drops to 60%. Low usage of booked capacities eats into the companies’ profitability and may also pull forward the end of the economic life for some of their wells.
Assessing the EUR
Below are some more details on the methodology used to assess the EUR for the average well by vintage.
For the assessment the wells economic life was split into 3 phases;
Phase 1. Actual or estimates on the cumulative flow above 100 bo/d.
Phase 2. Actual or estimates on the cumulative flow between 100 and 50 bo/d.
Phase 3. Actual or estimates on the cumulative flow between 50 and 10 bo/d.
Cut off for all estimates was at 10 bo/d. If this becomes lowered to 7 bo/d, this adds an estimated 7- 10 kbo to the cumulative/EUR.
The reason for choosing this approach was that some of the older vintages are now far down the decline curve to about 35 bo/d from where an exponential decline to the end of their economic life becomes a realistic assumption.
The younger vintages have a more stretched out initial profile, which transitions into an absolute and relative steeper decline, refer also figures SD 2 and SD 3. How the higher and growing Gas Oil Ratio (GOR) plays a role in this is much debated and being closely monitored together with developments in the water cut.
The younger the wells are, the steeper decline they have, and this is likely to last until they reach the 50 bo/d threshold, refer also figures SD 2 and SD 3.
It was assumed as the younger vintages of wells drop below 50 bo/d; these would follow the older vintages closely but with a slightly higher decline. The cumulative from 50 bo/d to 10 bo/d for the younger vintages, Phase 3, was expected to come in somewhat lower. The rationale for this is that their higher and growing GOR generally result in a steeper decline.
The 2018 and 2019 vintages were assumed to gain a higher cumulative that was equal to the differential to their 1- or 2-year older brethren until they reach 100 bo/d. The principle to estimate their cumulative until they reach 100 bo/d is shown in figure SD 1.”
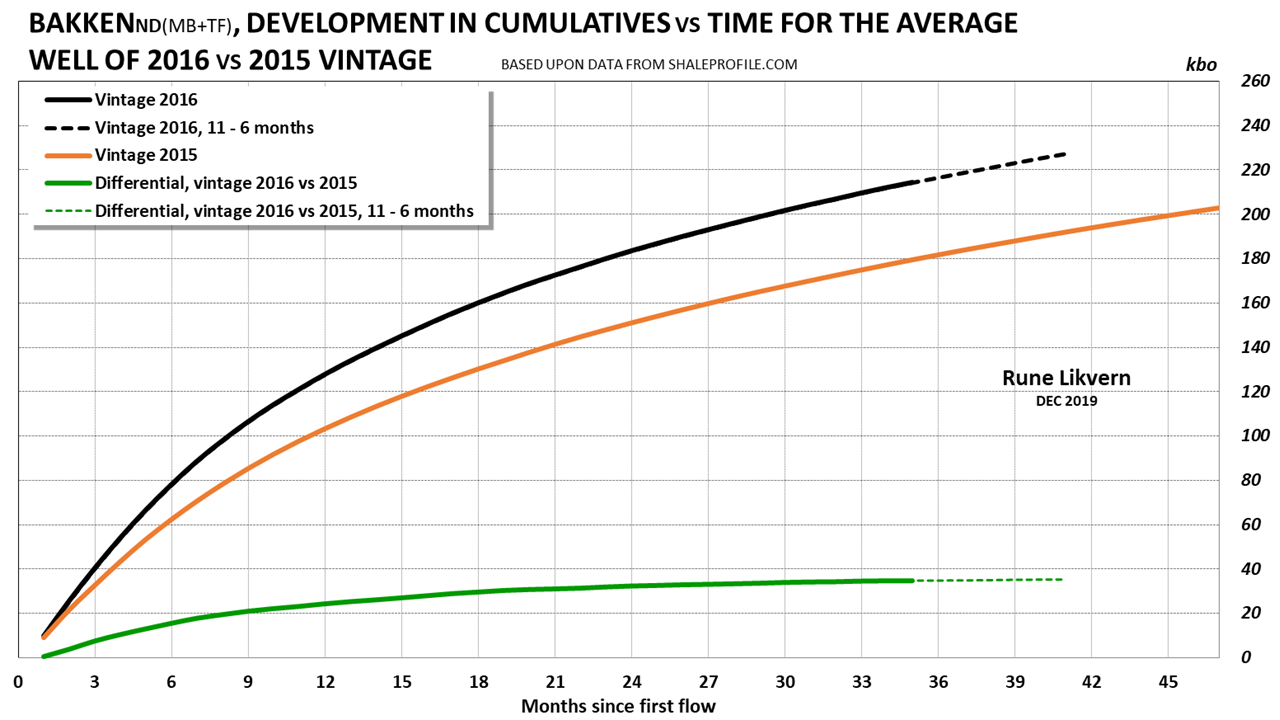
The green line show development in the differential in cumulative between the 2016 and 2015 vintages.
The chart shows the improvements in productivity. From observations from some companies, it is now good reason to expect that the differential will reach an apex from where the differential with time will decline somewhat.
The differential for the 2016 vintage is likely to reach its apex versus the 2015 vintage at about 36 kbo after 50 months after start-up. It is now expected that the differential for the 2017 vintage will reach its apex versus the 2016 vintage at about 42 kbo about 30 months after start-up. Rinse and repeat for the 2018 and 2019 vintages.
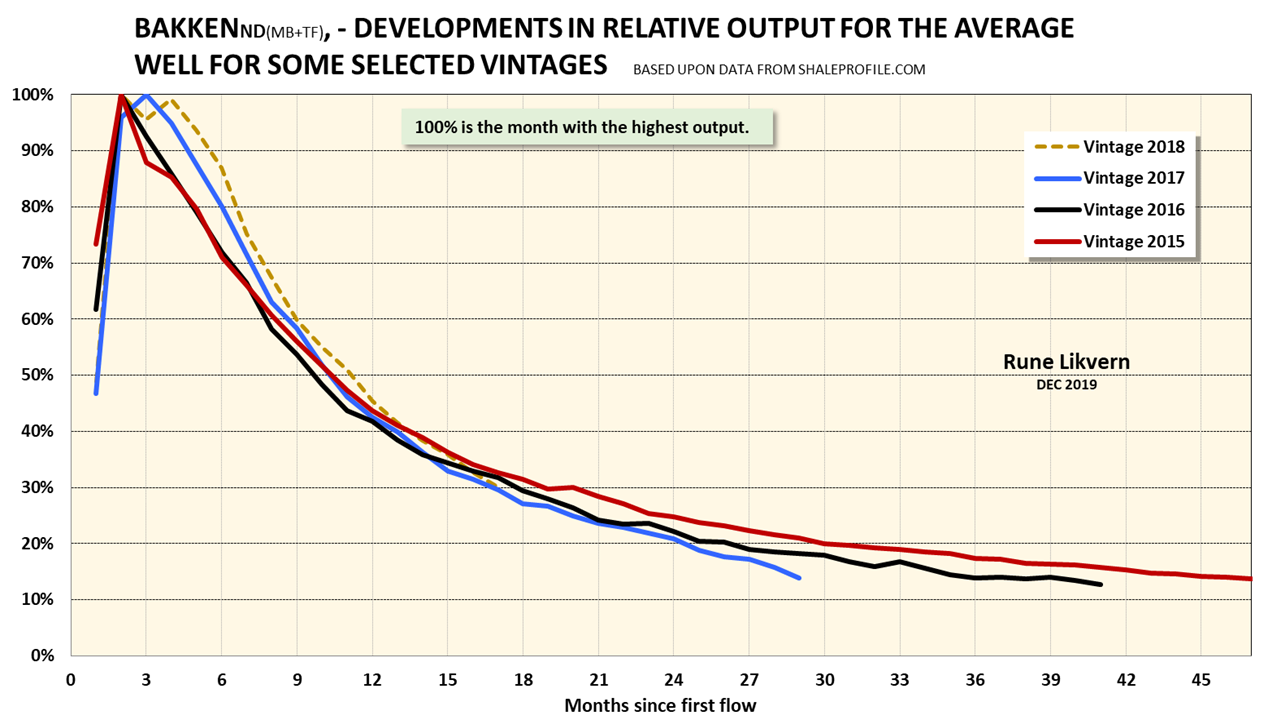
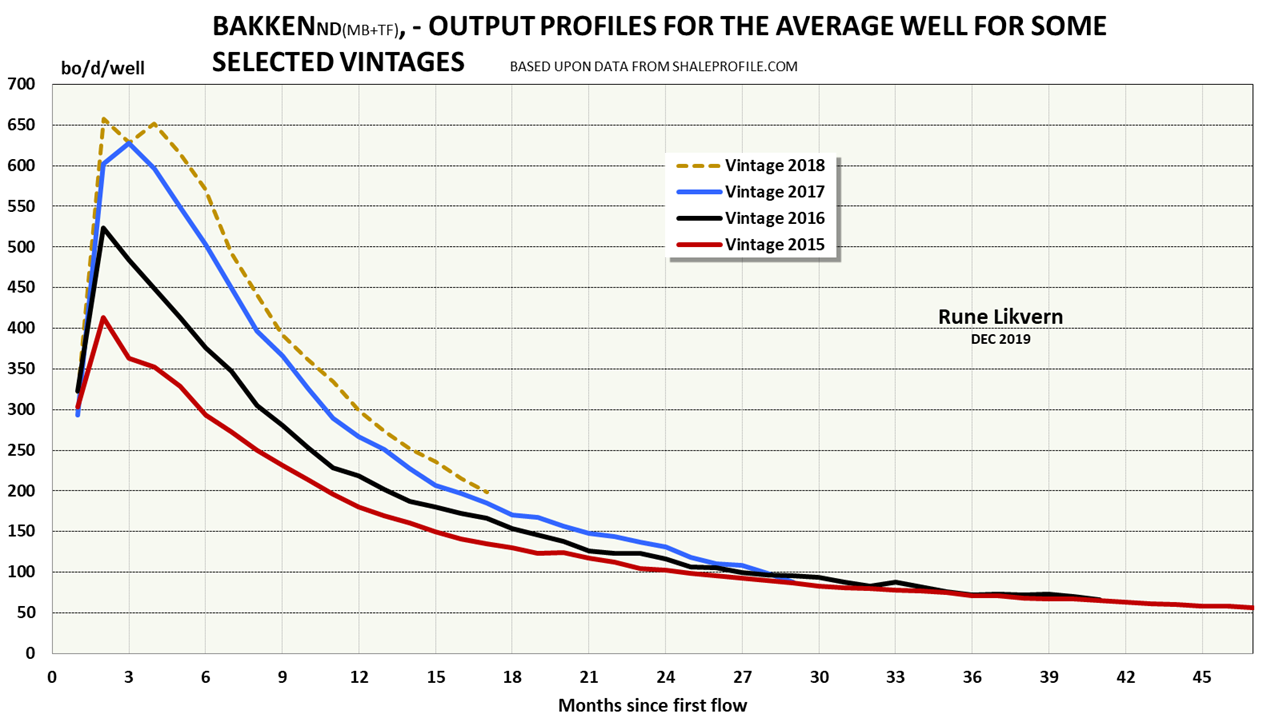
Figures SD 2 and SD 3 documents that the companies have succeeded in pulling the LTO extraction forward in time, which also improves profitability. Note as these reach about 40 – 50 months after start-up, their flows approach 50 bo/d.

NOTE: The time scale for the chart has been reset and starts with the first month below 100 bo/d.
The chart shows that as the younger vintages enter Phase 2, these tend to spend less time to decline from 100 bo/d to 50 bo/d. The younger vintages have steeper declines and thus tend to have a smaller cumulative during Phase 2 and 3.
As far as data are available for vintages that are in phase 3, these suggest that at some point between 50 bo/d and 40 bo/d and for the remaining economic life of the well the flow can be modeled exponentially with an annual decline in the area of 10% to 14%.
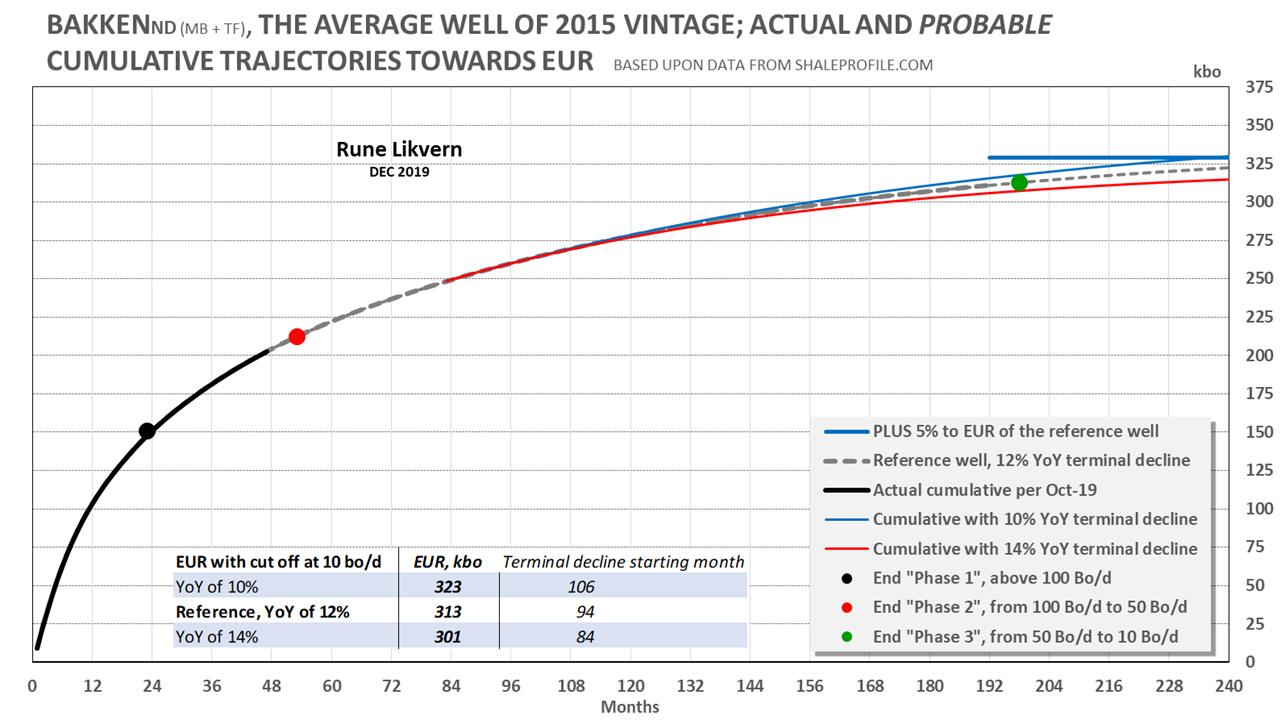
The chart illustrates that it still may take 12-15 years before we get the final answer about the EUR for the average 2015 vintage well.
Standard Operating Procedure (SOP) in oil companies is to look at discounted cash flows (DCF) for profitability assessments and low flow/net cash flow late (after 10 years) in the economic life of a field/well have little influence on the net present value (NPV) due to the growing dilution effects from discounting over an increasing number of years. The higher the discount rate, the less influence from late-life net cash flow.

The table shows how the companies with time have succeeded both in pulling extraction forward in time and significantly improve EURs. Both are big positives for well economics.
The oil and gas prices are still important factors influencing well/project economics together with costs for the wells.
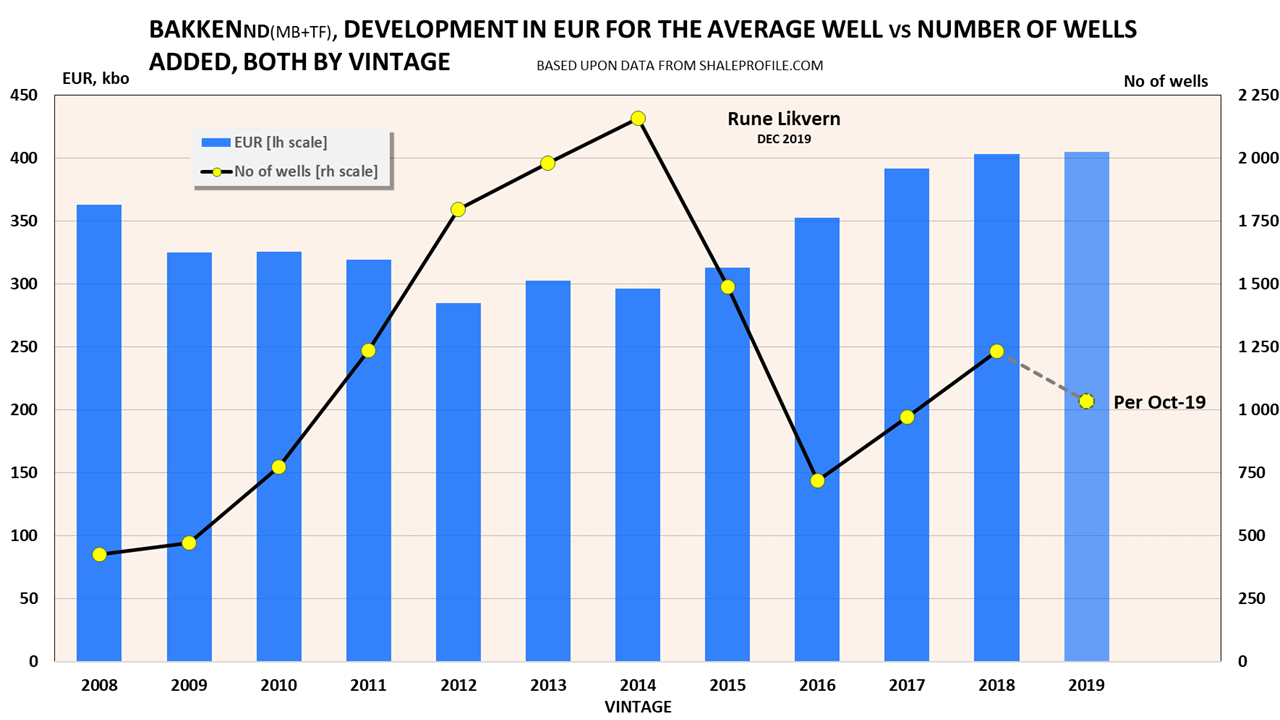
The chart shows that generally, there was a trend towards lower EURs after 2008 (included in some of the EURs for the early vintages are the effects from refracking), and it all started by drilling the fields (like Parshall) that had the highest production potential. From 2015 there was a significant improvement in the EURs resulting from improved well designs, more frack stages, and proppant usage. Recently these productivity improvements have slowed, and the most prolific fields are nearing saturation of wells.
Copyright © Rune Likvern 2020. All Rights Reserved.
Written for: Fractional Flow
Abbreviations and Acronyms
Bo/d, Barrels of oil per day
CAPEX, CAPital EXpenditures (costs, outlays)
CFO, Net Cash Flow from Operations
EUR, Estimated Ultimate Recovery, this is an estimate for potential recoverable oil and gas used to assess the profit/loss potential for a well or a field.
FCF, Free Cash Flow, customarily defined as operating cash flow minus CAPEX inclusive of dividend payouts.
Gbo, Giga (billion) barrels of oil
GOR, Gas Oil Ratio, customarily expressed as Scf/bo or MScf/bo.
kbo, kilo (1 000) barrels of oil
LTO, Light Tight Oil
Mbo, Mega (million) barrels of oil
NCS, Norwegian Continental Shelf
NDIC, North Dakota Industrial Commission
NDS, North Dakota (Williston) Sweet (one of the oil qualities pricing oil from the Bakken)
NGL, Natural Gas Liquids (primarily ethane, propane and butanes)
NPV, Net Present Value (or Discounted Cash Flow, DCF) is the discounted annual net cash flow of some specified period. The discount rate or return is what could be earned in alternative investments.
PDP reserves, Proved Developed Producing reserves that can be expected to be recovered through existing wells with existing equipment and operating methods.
R/P ratio (index), describes a theoretical number of years the estimated remaining reserves at some specified point in time will last if extracted at an annualized rate at that same point in time. This article uses a rolling 12-month total for annual extraction.
RRR, Reserves Replacement Ratio (typically expressed in %) says something about companies’ abilities to replace reserves as these are extracted, normally over a calendar year, and at the end of that same calendar year. An RRR above 100% results in growth in reserves and below 100% a decline in reserves.
SEC, U.S. Securities and Exchange Commission

You must be logged in to post a comment.