NOTE, this article is split into two parts.
The first part, the main body (5 500 words [includes text for charts and tables]), presents this analysis’s results.
The second part, supplemental information and documentation (3 000 words [includes text for charts), lists data sources, describes methods, abbreviations, acronyms, and some of the terms used in this article.
This analysis is a snapshot of Light Tight Oil (LTO) extraction in the Bakken in North Dakota (ND) treated as one big project with actual data starting in Jan-09 and a cut-off Dec-20.
…
Proven reliable methods on the Estimated Ultimate Recovery (EUR) for any well (or for the average well of specified vintage populations, plays, fields, companies, or other) is crucial to make estimates on remaining Proven Developed Producing (PDP) and Proven UnDeveloped (PUD) reserves which are the linchpins for assets backed lending (reserves-based lending).
EUR assessments based on realistic decline curves are the foundations for realistic forecasts on future cash flows, which form the basis for the companies’ financial planning, inclusive CAPital EXpenditures (CAPEX) for future well additions, and gatherings and processing systems.
Reserves-based lending is what the companies depend on to leverage their equities, inclusive owners’ capital for loans that together set the pace for developments of their acreage. These loans often come with clauses about the speed for drilling the companies’ area as the lenders want to see their capital returned with a profit within an agreed time frame. These loans come with covenants of various scopes commonly described by financial metrics, which the borrowers have accepted to honor.
In this article, I will focus on PDP reserves as there is more uncertainty associated with developments of PUDs in time, price, and cost.
This Bakken article uses the same comprehensive and granular analysis of the average EUR by vintage and developments for PDP reserves and R/P for the Bakken presented in the article Bakken, Something About EURs, PDP Reserves and R over P Ratio in January 2020.

NOTE; the chart in figure 1 shows an estimate (red area) on the development of total capital employed (equity and borrowed) (from Jan-09 to Dec-20) for the manufacturing of wells that needs recovery before profits.
The high use of inorganic funding in 2020 is due to a combination of the collapse in the oil price and companies curtailing production to reduce costs and supplies as a contribution to rebalancing the market faster.
The chart does not give any indication about future profits or losses.
Apply caution from generally projecting results presented in this article on companies.
For public companies, the best insights are derived from their SEC filings, researching theirs well population’s actual performances (like over at Shaleprofile.com) and applying some alternative proven metrics derived from existing data.
The rapid build in the Bakken LTO extraction, refer to figure 3, came in two cycles, the first from early 2009 to early 2015, resulted from heavily outspending cash flows from operations. A considerable portion of it was debt. This massive inorganic funding boosted production and cash flows from operations. The second cycle started in early 2017 and ended in late 2019 was, to a lesser extent, inorganic funded.
The relative increase in the decline rates for younger vintages, see figures SD 02 and SD 06, explain why the companies must remain on the treadmill to bring in many new wells to sustain/grow the production. More importantly, sustain/build their PDP reserves, which are the significant component for reserves-based lending.
- A broken growth cycle and years with a Reserves Replacement Ratio (RRR) below 100% with the subsequent rapid decline in estimated remaining Proven Developed Producing (PDP) reserves creates negative momentum. This negative momentum causes stresses to build on the balance sheets, which shifts focus to manage financial leverage within loan covenants.
- This study estimated remaining PDP reserves in the Bakken (ND) as of the end of Dec-20 to 0,9 GBo (Giga, billion barrels, gross).
The PDP reserves are from about 15 700 horizontal wells started from Jan-08 and per Dec-20.
See figure SD 10 at the end for the EURs for the average well of the 2008 – 2020 vintages used.
These estimates show that remaining PDP reserves were about 1,4 GBo in Jul-15 (refer also figure 2) with NDS at $35/Bo (annual average), and declined to 0,9 GBo with NDS at $29/Bo (yearly average) by the end 2020.
Since 2016 this study’s Reserves Replacement Ratio (RRR) for the Bakken was estimated below 100% (also refer to the table in figure 2), which means PDP reserves are shrinking and are now forecast to continue to shrink in 2021.
The combined drop in PDP reserves and price causes a dramatic shrinkage of the companies’ balance sheets. Also, refer to table 1. - This study juxtaposed its PDP estimates with the PDP numbers from the SEC 10-K filings for 2020 for some public companies heavily exposed to the Bakken (about 90% or more of their equity/entitlement production from the Bakken).
At the end of 2020, this study found that these companies’ SEC reported PDP reserves overstated by 30% – 50%. - An independent verification confirming overstated reserves would, for those affected, likely result in a downgrade of their credit rating. A downgrade to below investment grade would have far-reaching consequences as any institutional investors would likely have to sell their bonds into a liquid starved junk bond market. The companies would face much higher interest rates for debt rolled over, which eats into their cash flows unless the Fed takes these loans on their balance sheet.
- Should several independent and seasoned third parties verify the magnitude of overstated reserves, several LTO companies would find themselves cornered. The only way to try to paper over this would be to sweat it out while praying for a significant higher-lasting oil price (like $100/Bo or higher) soon.
Some companies could become severely challenged as any sale to buyers that did their due diligence based on actual well data could have come up with a much different assessment than the asked price based on the seller’s booked value.
A realized sale of a significant portion of the well portfolio reflecting the buyer’s offer would highlight that the seller’s booked to model PDP reserves are much lower.
A realized sale would likely force the seller to take considerable impairments, which subsequently would raise questions about the remaining PDP (and PUD) reserves on their books. And as the PDP reserves of one or several companies become questioned, more would follow.
Reserves booked based on assessments on actual data would fast reveal that many companies carry much higher leverage and likely are insolvent, which would compromise their plans. - The R/P (R/P; Reserves over Production) estimates for the Bakken as of Dec-20 was 2,1.
- Based on the estimated remaining PDP reserves (net or equity reserves) from this study, each barrel of oil in the ground carried a burden of about $50/Bo (includes net revenues from natural gas/NGLs) to recover the estimated employed capital of $36B as of Dec-20.
Another way to put this is that each barrel of oil has to net-back $50/Bo @ WH, or gross about $70 – $75/Bo @ WH to fully recover employed capital (owners’ capital and debt) and also pay for Plugging & Abandonment (P&A).
The estimated $70 – $75/Bo has not been inflation-adjusted for the period and only to nominally recover employed capital or break even, thus leaving no profit.
Simple project economics showed to earn a non-inflation adjusted return of 7% (for the Bakken as one big project) would require an oil price above $120/Bo @ WH for the estimated remaining PDP reserves as of the end of 2020.
Several companies have already been through debt restructuring processes, Chapter 11 proceedings, or significant write-downs that resulted in some far-reaching scrutiny from the owners.
A scenario with a sustained $50/Bo @ WH for the estimated remaining PDP reserves at the end of 2020 would result in total nominal losses of about $15B (for the Bakken as one big project).
If these estimates are close, more impairments will follow. - The above estimates should not be confused with estimates for a non-inflation adjusted breakeven or earn a 7% return for the average well in the Bakken of 2020 vintage with a EUR of 336 kbo, with a cost of $8,5M.
The average 2020 vintage well needs about $50 – $55/Bo to break even (non-inflation adjusted) and $56 – $61/Bo to yield a non-inflation adjusted return of 7%. All prices @ WH.
Adding producing wells while the price remains below the breakeven price is either one way to dig oneself a deeper hole or enter into a bet that the near future oil price will become significantly higher.
The numbers above are based on the EUR of the average 2020 vintage well. Wells with higher EURs have a lower breakeven price and make some defined returns at a lower price and vice versa for wells with lower EURs. - Why breakeven does not cut it
Breakeven is what price a field development, new well requires to recover its investment nominally.
To refer to making breakeven as a success is at best misleading. The reason is that this does not adjust for inflation from the investment was made until the entire nominal investment is fully recovered and returned to its investor.
Figure 1 illustrates the challenges facing the investors.
$1 invested in 2009 will over some time become recovered from oil/gas sold. In aggregate, as one big project, Bakken has been cash-flow negative since 2009, which was the starting point for this analysis. In other words, this $1 became recirculated as soon it broke the surface into adding producing wells and thus reentered as employed capital.
Just for illustrative purposes, assume that this $1 will be recovered in 2021 and returned to its investor.
The investor’s $1 from 2009 becomes returned as $1 in 2021 (the investor broke even!).
The point here is that the $1 from 2009 by 2021 has lost considerable purchasing power relative to 2009.
By applying an average annual inflation rate of 2%, the investor needs $1,27 in 2021 to maintain the purchasing power from the $1 invested in 2009. The $1,27 (in 2021) is without any profits or return was made on the investment. - Above it is shown as per Dec-20 in what a stressful state the Bakken well population are. Now it is expected that the oil price will remain at current levels in 2021 ($45/Bo [NDS] @ WH), and the R/P index of 2,1 stipulates that the legacy production is in for a steep decline, and actual data indicates this decline will be about 42% Year on Year (YoY).
A 42% YoY decline in oil extraction has severe consequences on the cash flow and the ability to add producing wells organically, service debts, and pay dividends.
The longer the oil price remains below breakeven or to make some defined return, combined with the steep decline of the legacy PDP reserves, the higher the breakeven price and the required price for some defined return for the rapidly declining legacy PDP reserves becomes. - Based on the SEC – 10K filings for several companies, Value at Risk (and looking at the Bakken as one big project) is primarily with the investors. Many companies are operating in the Bakken, and the leverage and risk profile vary amongst these.
- The points above show that most investors in the Bakken will not worry about breakeven or returns, but how many cents become returned for each $ invested.
- Management in many shale companies had a performance incentive structure in which growth in oil extraction was dominant. Usually, a business focuses on profitability.
The logic behind this may have been rooted in a misguided belief that the inflated EURs (forming the basis for a book to model) for some time justified outspending cash flow from operations. Inflated EURs allowed for faster growth of assets (thus equity) than debt (liabilities). Financial leverage and insolvencies were probably not considered to become an issue as long the oil price remained high.
Using financial leverage to grow a business is highly effective if the leverage works to one’s benefit.
If financial leverage does not work, it turns on those applying it and eradicates them.
In other words, the belief could have been that a high portion of inorganic funded additions of wells over time would justify high financial leverage as assets/equity would grow faster than liabilities.
Support for this belief may also have been that the oil price would remain high and only go up. And if it did not, OPEC+ would intervene.
The above would have worked if their EURs and their expectations for a sustained high oil price had materialized.
Both in the Bakken and the Permian, the financial leverage and the lasting “low” oil prices now turn on them who applied it.
When expectations about a book to model EURs, growth in the oil price, and all favorable shales are thrown into several friendly echo chambers to reinforce and repeat some wished-for outcome, it will over time become perceived as some truth. THE TRUTH will, over time, find its way to the daylight. - Over the next 1-2 years, managements of LTO companies will develop and implement alternative strategies. These strategies will search for striking a balance between the allocation of available capital to sustain or grow their production and reserve base (used for reserved-based lending), deleverage, and pay dividends to a growing number of impatient owners.
To exacerbate this challenge, the banks now have shortened the lines of revolving credit, reduced loans, and voiced concern that the assets of some shale companies will not fully cover the loans. This situation generally describes a balance sheet/accounting insolvency, and if the condition persists, creditors and lenders could force companies to sell assets or declare bankruptcy.
At current oil/gas prices, this becomes an exquisitely balancing act as any financial deleveraging and dividend payouts eat into funds that otherwise could be made available to manufacture more wells to slow the declines in oil extraction and PDP reserves. - Reducing CAPEX for well manufacturing below some threshold to generate some Free Cash Flow (FCF) comes with tough catches. These come not only from the prospects of a decline in production/extraction and thus operational cash flow.
Changes to the Reserves Replacement Ratio (RRR) are essential parameters to follow and affect PDP reserves. Many companies have relied heavily on reserves-based lending, and a significant decline in PDP reserves will, by default, increase financial leverage and stress test some of the loan covenants. - Covenant light loans give less protection for investors. Credit rating agencies have flagged problems with these for years, and issues with leveraged loans can happen overnight. It is challenging to see stress building on balance sheets from inflated oil and gas reserves estimates.
Realistic EURs and R/P estimates (produced by competent and independent third parties) could become a real game-changer for the future pace of US LTO developments. - In recent years, I have also come to use the global credit impulse as one of the major leading indicators to predict the oil price band one year forward. In August 2018, I used the global credit impulse (amongst several other indicators like supply and demand, storage, etc.) to predict the oil price one year forward.
Now few things suggest that the global credit impulse will support a material higher oil price in 2021. Throwing in the developments for the US interest rates, DXY (USD Index), fiscal and monetary policies, developments in household net income (excluding government transfers), affordability dynamics and more, makes me now expect a price band of $55 – $70/Bo for Brent for 2021.
OPEC+ may adjust supplies to control the oil price and constrain supplies from competitors. But OPEC+ has no control over changes to the global credit impulse, the future strengths/weaknesses to the USD, and developments in affordability among global consumers.
In 2019 an average oil price in the mid-’60s (Brent) triggered protests amongst consumers in several economies. There is a limit to how much higher the oil price for struggling US consumers can rise before it starts to affect consumption. The affordability threshold in recent years has declined with the higher and continued growth in total global debt.
My expectations for the oil price for 2021 are in line with most other analysts, and if that comes true, LTO operators should not expect much financial relief from the oil price this year.
Development in the Bakken PDP Reserves
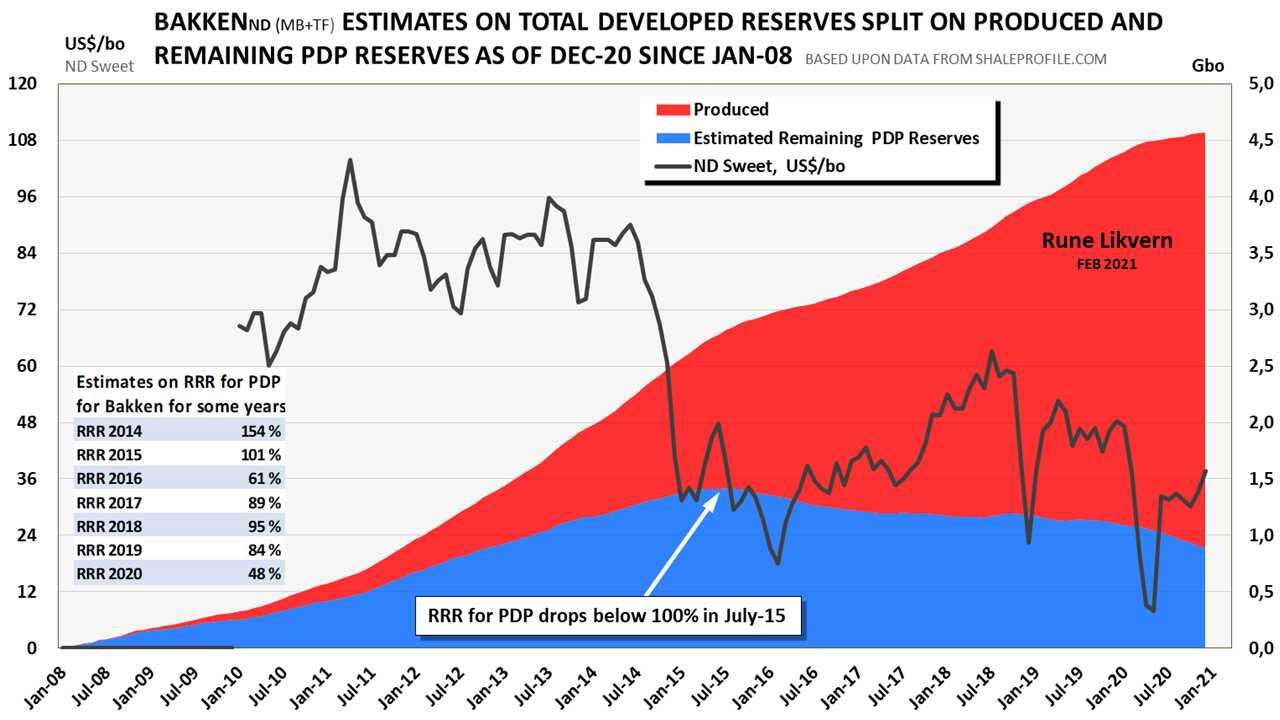
Figure 2 shows that from Jul-15 to Dec-20, the estimated remaining Producing Developed Reserves (PDP) for the Bakken dropped from 1,4 GBo to 0,9 GBo or about 38%.
In other words, PDP reserves were extracted/produced at a faster rate than those added from new producing wells.
The low R/P ratio (index) of 2,1 for the Bakken at the end of 2020 gives expectations of a steep decline in extraction from the growing population of legacy wells, which results from Light Tight Oil (LTO) wells had steep and now steeper relative declines, refer also figure SD 02.
The average NDS was at $46/Bo in 2019 and dropped to $29/Bo for 2020, while PDP reserves dropped from 1,11 GBo to 0,89 GBo. For 2020 the RRR was estimated to 48%.
The combined drop in PDP reserves and price dramatically shrinks the companies’ balance sheets.
Declining PDP reserves shrink the companies’ balance sheets and increase leverage which, all things equal, have the companies focus on loan covenants and ways to reduce the drag from debt. All of this results in changes to development plans to control leverage and stay within loan covenants.

The R/P (ratio/index) for the Bakken was estimated to be about 2,1 as of Dec-20, which signals a steep decline in future oil extraction from the legacy PDP reserves (legacy population of wells).
The low R/P ratio is an advance notice for a steep decline in legacy PDP reserves which only can be offset by a high rate of well additions (high CAPEX). To offset the steep declines in extraction and PDP can only be achieved at current oil prices through CAPEX spending considerable above organic cash flow from operations.
The above illustrates where the rock now meets the hard place. Declining extraction, and all things equal, reduce cash flow from operations. A continuous decline in estimated remaining PDP reserves will relentlessly build stress on the balance sheets.
Adding Producing Wells from Cash Flow from Operations (CFO)
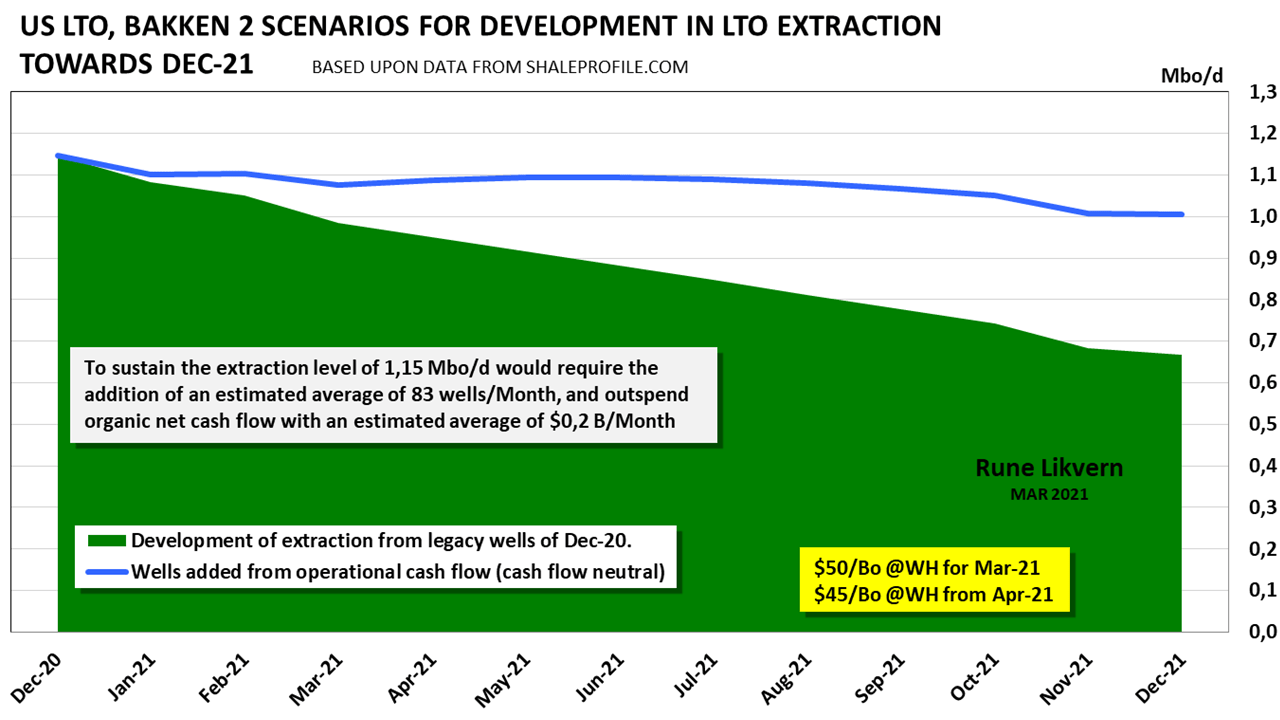
Figure 4 presents the results of a simplified exercise that tried to answer the question; How would LTO extraction develop in the Bakken (MB+TF) over the next 12 months (Dec-20 to Dec-21) where (all) net cash flow from operations was used to adding producing wells inclusive the completion of 120 DUCs?
The exercise had no conditionality concerning the outlook for profitability for the wells added.
The initial condition was extraction as per Dec-20 of 1,15 Mbo/d, and the average 2021 well assumed to be 2% better than the average 2019 vintage, giving about 172 kbo after 12 months and with a wellhead price of $45/Bo as from Apr-21.
The number of DUCs as per Dec-20 in the Bakken was around 660, according to Shaleprofile.com.
The chart above shows how the development in LTO extraction from legacy wells per Dec-20 (green area and based on actual data) is projected to develop towards Dec-21.
The blue line shows the forecast of how the LTO extraction would develop if more than 700 wells (including 120 DUCs) were organically funded.
For 2021 cash flow from operations could allow for the addition of about 700 wells (including 120 DUCs). To sustain the estimated remaining PDP reserves from end 2020 to end 2021 would require about 1 300 wells.
At the current oil price, this would result in outspending cash flow from operations with more than $5B in 2021 (600 wells at average well cost at $8,5M).
The addition of 1 300 wells in the Bakken in 2021 would grow extraction from 1,15 MBo/d (end 2020) to an estimated 1,30 MBo/d (end 2021).
As far as actual data for the Bakken for 2021 are available, the well additions have been below the required to sustain oil extraction along the blue line. Active rigs have stayed around 15 as per Apr-21, suggesting that well additions for the first half of 2021 will result in LTO extraction below the blue line in figure 4.
Suppose some companies prioritize paying dividends or reducing leverage (which is likely) or both from cash flow from operations. In that case, less CAPEX will be available for well manufacturing resulting in a steeper decline in LTO extraction than the forecast shown with the blue line.
From the recent Bakken developments and information from SEC 10-K filings, I now expect the LTO extraction from the Bakken to exit 2021 at around 0,9 MBo/d.
A development in LTO extraction above the blue line requires (in aggregate) inorganic funding; that is, it requires funding from more debt or assets sales or both. As measures were put in place to contain Covid-19, this caused the oil price to dive, and companies promptly responded by cutting back on extraction while drawing down their revolving credit lines or sold assets or both to get hold of cash to build a “war” chest which would allow them to ride out the storm. From Mar-20 and as of Dec-20, it took an estimated $2B inorganic funding for offsetting impacts from lower CFO in the Bakken.
These measures increased the companies’ financial leverage. That was likely a price they deemed acceptable as early indications were that the efforts put in place to contain Covid-19 were transitory, and business as usual (BAU) would resume in a few months. It has not turned out that way; the effects from Covid-19 have now proven to last longer and have more profound economic consequences.
All of this creates a reality where an industry that already was losing favors with the financial world will find that their “war” chests to ride out the storm was not adequate. Soon this industry will have to balance what cash flow from operations allows them to add new producing wells, deleverage (debt reductions) and pay dividends.
There is more
If LTO extraction from the Bakken became based on no wells added post-Dec-20 (which is not likely), the output from the population of legacy wells would drop from an estimated 1,15 Mbo/d in Dec-20 to 0,67 Mbo/d (a YoY decline of about 42%) in Dec-21.
More importantly, the estimated remaining PDP reserves would, in such a situation, drop from an estimated 0,89 GBo (gross) in Dec-20 to about 0,58 GBo (gross) in Dec-21. Such a drop would significantly impact the companies’ balance sheets (assets and equity). As for assets and equity, a higher oil price in 2021 will offset much or all the decline from PDP reserves. The decline in output also impacts the companies’ net cash flow from operations constraining their CAPEX and abilities to add producing wells to counter the effects from the steep declines.
Developments in PDP reserves are critical to reserves-based lending.
If net cash flow from operations from Dec-20 to Dec-21 are entirely used towards adding producing wells. And with the assumptions used for figure 4, the estimated remaining PDP reserves would drop by about 150 Mbo (gross, and a drop of about 17%). The RRR would become an estimated 60%, which increases stresses on the companies’ balance sheets and results in a different allocation of net cash flow from operations, which means directing a more significant portion of the cash flow towards deleveraging (reducing debt) to honor any loan covenants. Such a situation may challenge any dividend payouts.
Then there is the scenario with adding producing wells at a rate that sustains the extraction level of Dec-20 to Dec-21.
This scenario requires the addition of an estimated 1 000 wells (an average of 83 wells/month) and requires inorganic funding (use of external capital, primarily debt) of an estimated $2,3 Billion. For this scenario, the remaining estimated PDP reserves would decline about 75 Mbo, translating into an RRR of 82%.
There are, of course, no certainties, only probabilities about future developments for the Bakken.
Figure 1 shows the historical developments in estimated annual net cash flow and the cumulative from operations in the Bakken. Over time the probabilities work against future CAPEX levels based on a continuous high portion from inorganic funding [growing debt] as this requires rapid growth in the oil price needed to meet some defined return on investments (employed capital [debt + equity]).
After some time with a lasting ” low ” oil price, the effects of high financial leverage and the pursuit for some defined profit (or returns) will initiate revisions.
A little on Balance Sheet dynamics
What follows is simplistic and only intended to illustrate the balance sheet dynamics for the scenario where extraction of 1,15 Mbo/d at exit 2020 declines to 1,00 Mbo/d at exit 2021 (the blue line in figure 4).
What follows is based on a company that recently came out of Chapter 11 proceedings.
As of the end of 2019, the company had a debt ratio to stockholder’s equity of 70% (the leverage).
Note several metrics are used to assess a company’s financial health, which are included in the loan covenants, and which the companies have agreed in writing to honor.
There are several definitions for leverage and in the continuation, refer to the description in bold above.
The remaining estimated PDP reserves for this Bakken scenario were estimated to decline by about 147 MBo (gross), and an average royalty of 18% reduces PDP by about 120 MBo (net equity) in 2021. Assuming the netback from 2020 to 2021 increases to $21/Bo (inclusive net from natural gas/NGL sales) results in a nominal net value for the assets/equity to about $13B (Dec-21).
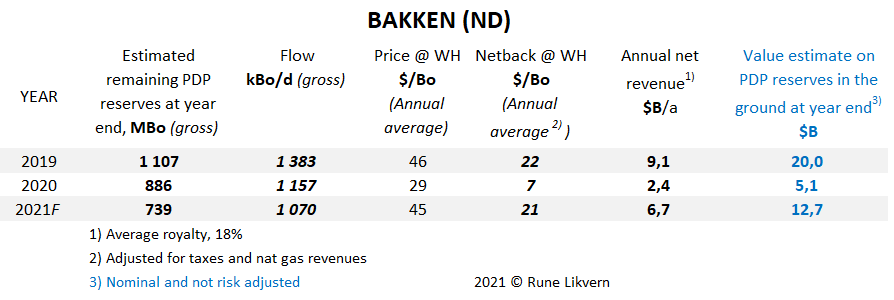
2020 may be considered abnormal. Note how the expected decline in the nominal value estimate (not risk-adjusted nor discounted) for the estimated remaining PDP reserves changes from 2019 to 2021.
Usually, the outmost right column would be presented as the risk-adjusted standardized measure of discounted future net cash flows at 10% (PV10). The table is here primarily intended to illustrate the financial dynamics taking place on the balance sheets.
Table 1 illustrates that with a broken growth cycle, followed by years with a Reserves Replacement Ratio (RRR) below 100%, and the subsequent rapid decline in estimated remaining Proven Developed Producing (PDP) reserves, it creates a negative momentum that causes stresses building on the balance sheets which shifts focus to manage financial leverage within loan covenants (as opposed to focusing on LTO extraction levels).
The above needs to be seen in the context that at the end of 2019, estimated PDP reserves were at 1,11 GBo (gross) [0,91 GBo net] while the average NDS was about $46/Bo with a netback above $22/Bo or a nominal net PDP value of approximately $20B.
For 2021 the forecast for the nominal net PDP value for this scenario (blue line in figure 4) is a decline to about $13B.
In aggregate, the companies present their plans and estimates to several lending institutions. These agree, after doing all their (updated) due diligence with risking of the assets, to revise lending in such a way that the leverage (ratio of debt to stockholder’s equity) in this simplistic illustration (applying PDP reserves) remains at 70%. Here, total lending would become reduced by about $2,8B, from $8,2B at the end of 2019 to $5,4B at the end of 2021.
(An actual estimate is more comprehensive as the companies’ employed capital, paid-in capital, retained earnings, and others would be entered into the equation as equity. The purpose of this simplistic presentation was to illustrate how declining PDP reserves produce stresses on the balance sheets and affect leverage, which shifts attention from well manufacturing to manage financial leverage and honor loan covenants.)
Lending institutions are aware that there are risks involved with oil extraction like the oil price, reservoir uncertainties, changes to reserves, and changes to regulations, to name a few.
From what is described above for Bakken, it is likely the companies (in aggregate) soon are forced into deleveraging [debt reduction] to stay within loan covenants. For this reason, it should be expected that CAPEX in the Bakken will soon reflect this, resulting in more declines in extraction levels.
Typically big loans to corporations are syndicated. Several big Wall Street banks and other lending institutions recently had to take significant losses from said company’s (used as the model) recent prepackaged Chapter 11 debt restructurings.
It is widely claimed that lending to the shales became motivated by the commission fees from the successful syndication of loan grants. What appears to have evolved into an exclusive, myopic rapidly, and growing echo chamber (the definition of a mania) that primarily accepted analysis reinforcing the belief in the “new normal.”
“The new normal” was a sustained oil price at or above $100/Bo, which finally would allow the US long sought for “Energy Independence.” The shale hype by many big Wall Street banks whose judgments were influenced by many companies’ presentations of unrealistic EURs derived from 30 days (or fewer) Initial Production (IP). These IPs were derived from procedures that would make the Spanish Inquisition appear as the role model for all ethics.
The financial reality increasingly rears its ugly head for the shales, and it will likely get uglier. The same financial institutions (that a few years ago hyped the shales and ignored all the incoming torpedoes from all 360 degrees) must get used to the menu of scrawny servings at the banquet of consequences.
The Oil Price near Term
In the process of deciding what oil price to use for the scenarios in figure 4 [towards Dec-21], I, after some deep and time-consuming research and considerations, landed on the side that the recent growth in the oil price (ref also copper, other commodities) was primarily an effect from the present reflation trade [ref the lower DXY, weakening USD]. All of which resulted from the perceptions created by the Federal Reserve about incoming higher secular inflation.
This reflation trade seems like a “one-sided bet” on shorting the USD (short bonds [yield increasing causing a bond rout due to expectations of higher inflation], long commodities [note how several commodities have come up in price denominated in USD], long equities. All these trades are vulnerable to the risks from shutdowns that have a lasting impact on the labor market that will take years to recover.
Looking at several economic indicators and metrics around the world, many of these still scream incoming deflation.
Should this reflation trade turn sour, it will cause a strengthening of the USD (higher DXY), which will pose a considerable risk for several reflation assets, like oil.
Now I hold it probable that the Bakken PDP reserves will continue to decline by an estimated 20% towards the end of 2021.
Suppose the additions of more wells from available capital (both organic and inorganic) over time remain below some threshold (RRR< 100%). Then many companies start to flirt with breaching loan covenants as RRR remains below 100% and could soon find themselves responding to a reality where they have to prioritize financial deleveraging, thus diverting funds from well manufacturing.
Such a situation creates a kind of “doom vortex” whereby financial deleveraging restricts the level of well additions. As this dynamic continues to play out, it continually develops stress on the companies’ balance sheets.
SUPPLEMENTAL INFORMATION AND DOCUMENTATION
An analysis like this results from a continuous data, facts, and logic-driven, interdisciplinary process that now spans many years and includes valuable, constructive, relevant feedback, discussions, and proposals from management in several US oil and oil-related companies. Everyone contributed for free as the objective was to present as close to a realistic picture of the developments and status of the US LTO industry as far as public data allow.
Data for this study comes from Shaleprofile.com and their article North Dakota – update through December 2020, which presents data on the close to 16 000 horizontal wells started in the Bakken (ND) as from Jan-08 and per Dec-20.
The economic analysis for Bakken used an average royalty of 18% and production and extraction taxes of 10%.
For Lease Operating Expenses (LOE), marketing, transportation and gathering expenses, General and Administrative (G&A), and revenues from natural gas and NGL’s sales, a volume-weighted average derived from several public companies SEC 10-K/Q filings has been applied. Total employed capital was subject to average interest expenses set at 6% (adjusted for “tax rebate.”)
Owners paid-in capital, retained earnings, etc. has also a price as the owners’ capital has alternative uses.
At the end of the well’s economic life, Plugging & Abandonment (P&A) costs of $150k – $200k are included.
The costs for acreage, hedging effects, and Drilled UnCompleted (DUCs) wells are not included in the economic analysis for the Bakken as one project. The financial analysis covers well manufacturing and operations.
For some economic analysis, the retirement of employed capital fulfilled as fast as CFO allowed (which may be conservative). Some of the costs like LOE, interest expenses (modeled to decline as capital is recovered), G&A, marketing, transportation, and gathering are made volume dependent (these are modeled to have small volume elasticity over short time frames).
The post, including transportation and gathering, could prove challenging for companies that have booked capacities that they, over time, cannot fully utilize due to a decline in extraction. Typically, transportation, gathering, and processing (treatment) contracts have “ship or pay” clauses, meaning that not used booked capacity results in the growth of the specific costs at the inverse of the utilization rate.
A company with specific transportation, gathering, and processing costs of $5/Bo utilizing 100% of their booked capacity could find their specific transportation and gathering costs grow to ($5/0,6)/Bo = $8,33/Bo if their utilization rate drops to 60%.
Low usage of booked capacities eats into the companies’ profitability and may also pull forward the end of the economic life for wells far down the decline curve.
Assessing the EUR
Below are some more details on the methodology used to assess the EUR for the average well by vintage.
Some will refer to the method as a hybrid of using reported realized production from the last reported month (here Dec-20) and estimating the remaining cumulative based on the performance from the more recent older vintages that are further down on the decline curve.
With this method, the EUR approaches UR as any vintage nears economic cut-off.
This method [which is time-consuming] probably improves accuracy as the portion of realized production grows with time. Consequently, it reduces the part that remains estimated (as more data is reported and included, it reduces the span of uncertainty.)
For the EUR assessment, the economic life of the average vintage well is divided into 3 phases.
Phase 1. Actual (realized production) and estimates on the cumulative above 100 Bo/d.
Phase 2. Actual (realized production) and estimates on the cumulative between 100 and 50 Bo/d.
Phase 3. Actual (realized production) and estimates on the cumulative between 50 and 10 Bo/d.
Cut off for all estimates was at 10 Bo/d. If this becomes lowered to 7 Bo/d, this adds an estimated 7 – 10 kbo to the cumulative/EUR. Cut-off may vary dependent on GOR developments, the water cut, and the oil price.
The economic cut-off for LTO wells is up for some debate. As little data or studies are available on this subject in the public domain, it requires educated guessing.
Operators may be motivated by one or several considerations that may allow some wells to run at some loss, like;
- Wells allowed flowing at a loss likely have some booked remaining Proven Developed Producing (PDP) reserves that give an oversized contribution to the assets/equity on the companies balance sheets.
The PDP reserves of such wells have to come off the books (reduced assets/equity) when P&Aed. - Deferment of Plugging and Abandonment (P&A).
There is no reason to P&A low flowing wells if the economic analysis shows a positive Net Present Value (NPV) by tolerating a slight operational loss from these that are less than the benefits from the deferred P&A. - Hold acreage by production. The potential low losses from marginal wells are justified by holding acreage that has attractiveness at a higher oil price.
Some expect the cut-off to be at the higher level of between 15 Bo/d and 18 Bo/d based on high-cost intervention expectations.
Anyhow, any future revisions to EURs and PDP will reflect what actual data shows.
This approach/method resulted from the older vintages now are at about 35 Bo/d on the decline curve. An exponential decline derived from actual data of older vintages to the end of their economic life appears as a proper fit.
Based on decline developments derived from actual data, this could be conservative as actual developments show an acceleration in the decline as the wells move beyond 90 months of extraction. As of writing, the younger vintages have higher documented decline rates; also refer to figure SD 05.
The higher and growing Gas Oil Ratio (GOR) plays a role in this debate. The GOR and water cut developments are monitored and interpreted. As pressure and temperature data for the wells are not available in the public domain, other parameters may assist in understanding what is happening in the rocks.
The younger the wells are, the steeper decline they have, and this is likely to last until they drop below the 50 Bo/d thresholds; also refer to figure SD 01 and SD 06.
The cumulative for the 2018 and 2019 vintages were assumed to equal the differential of their 1 – 2-year older brethren until they reach 100 Bo/d. From here, it gets a bit more complicated, as described below.

Figure SD 01 shows absolute developments in the flow for the average well by vintage versus time.
Just as important is to visualize the relative developments in the flow for the same wells, ref figure SD 02 below.

Note also that the younger vintages reach the 10% relative flow (of max) threshold faster.
NOTE: The time series for the 2016-2019 vintages were extended with data for wells with “only” 11- 6 months of reported flow. Over time and as all data points got to 12 months of flow, the observed changes were tiny.
Figures SD 01 and SD 03 documents that the companies have succeeded in pulling the LTO extraction forward in time, which generally improves profitability. As these reach about 50 – 60 months after start-up, their flows drop below 50 Bo/d.

The chart documents that longer laterals, more frack stages, and more proppants over time have improved the cumulative extraction of LTO.
As of writing, the average well of the 2018 vintage will probably represent the high in the Bakken.

The chart shows the cumulative for the average 2015 vintage (orange line) and the cumulative for the 2016 vintage (black line). The dotted lines show the cumulative for wells with 11 – 6 months of flow.
The green line show development in the differential in cumulative between the 2016 and 2015 vintages.
The chart shows the improvements in the cumulative for the average 2016 vintage versus the older 2015 vintage. The chart shows that the 2016 vintage, after about 35 months, declines faster than the 2015 vintage, reducing the differential in cumulative. After some time, the declining differential suggests that the 2016 vintage enters a period with a higher decline rate.
As of now, this development will likely continue.
From observations from some companies, actual data now gives reason to expect that the differential in cumulative at some point for the younger vintages will reach an apex from where this differential will decline (over time, there will be some convergence in the cumulative).

The green line show development in the differential in cumulative between the 2018 and 2017 vintages. The chart documents that for the vintages presented their differential in cumulative reached an apex after about 20 months of flow, and later the differential in their cumulative started to decline.
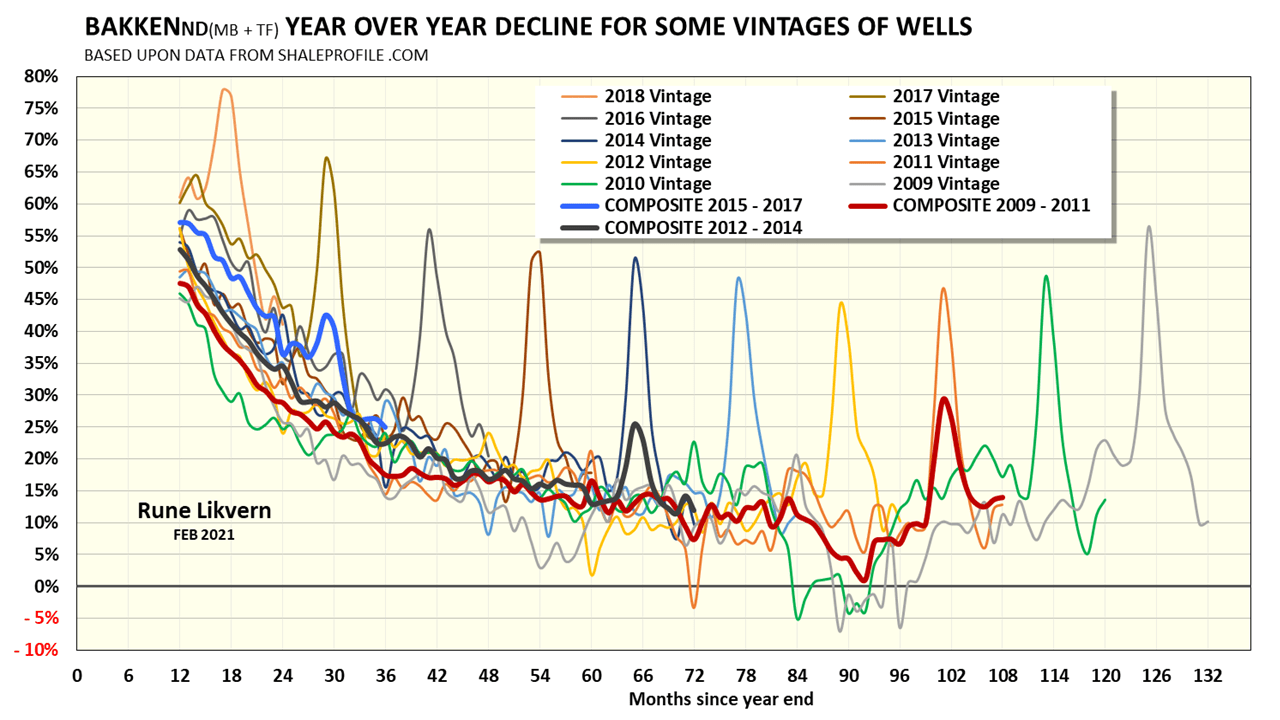
The chart also shows the weighted composite for groups of vintages, namely 2009 – 2011 (thick red line), 2012 – 2014 (thick black line), and 2015 -2017 (thick blue line).
The start point (T = 0) for the population of any vintage is at Dec-year n. The decline after 12 months is the collective decline for the population of subject vintage wells, at year (n+1).
[How to read the chart: the collective YoY decline in flow from the population of the 994 wells of 2017 vintage from Dec-17 to Dec-18 (after 12 months) was about 60%.]
Figure SD 05 shows some interesting trends:
- The relative declines increase as the vintages get younger; also refer to figure SD 02.
- Declines appear to generally increase for the oldest vintages as these reach 80 – 100 months of flow.
For the younger vintages, as these drops below 50 Bo/d after about 50 months since first flow, the YoY decline rate is at 15-20%.
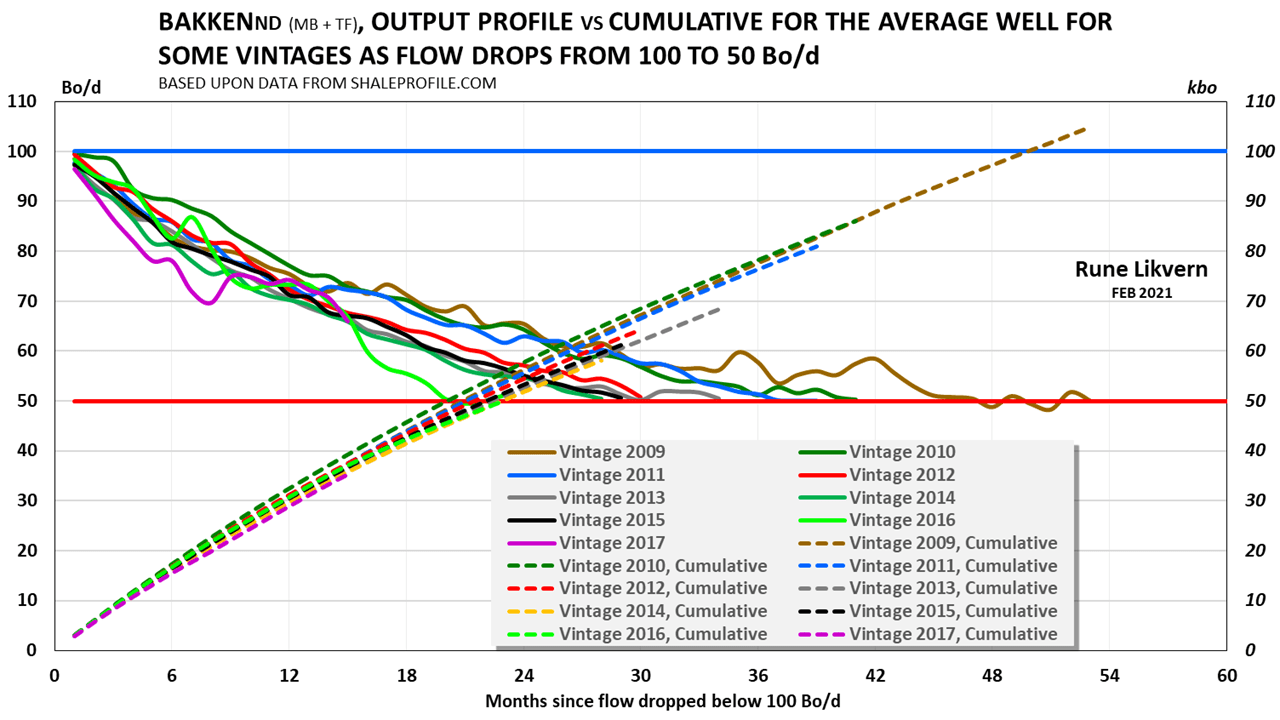
NOTE: The time scale for the chart has been rebased and starts with the first month with flow permanently below 100 Bo/d.
The chart shows that as the younger vintages enter Phase 2, these tend to use less time to decline from 100 Bo/d to 50 Bo/d. The younger vintages have higher decline rates and a lower cumulative during Phase 2.
The younger vintages since 2014 have a cumulative in phase 2 in the range of 50 – 60 kBo.
It was shown earlier in the article that the decline rate increased as the vintages got younger. In figure SD 07, note that the 2017 vintage, and as far as data are available, now are on a trajectory that results in a lower cumulative in phase 2 than the 2016 vintage.
Refer also to figure SD 02.
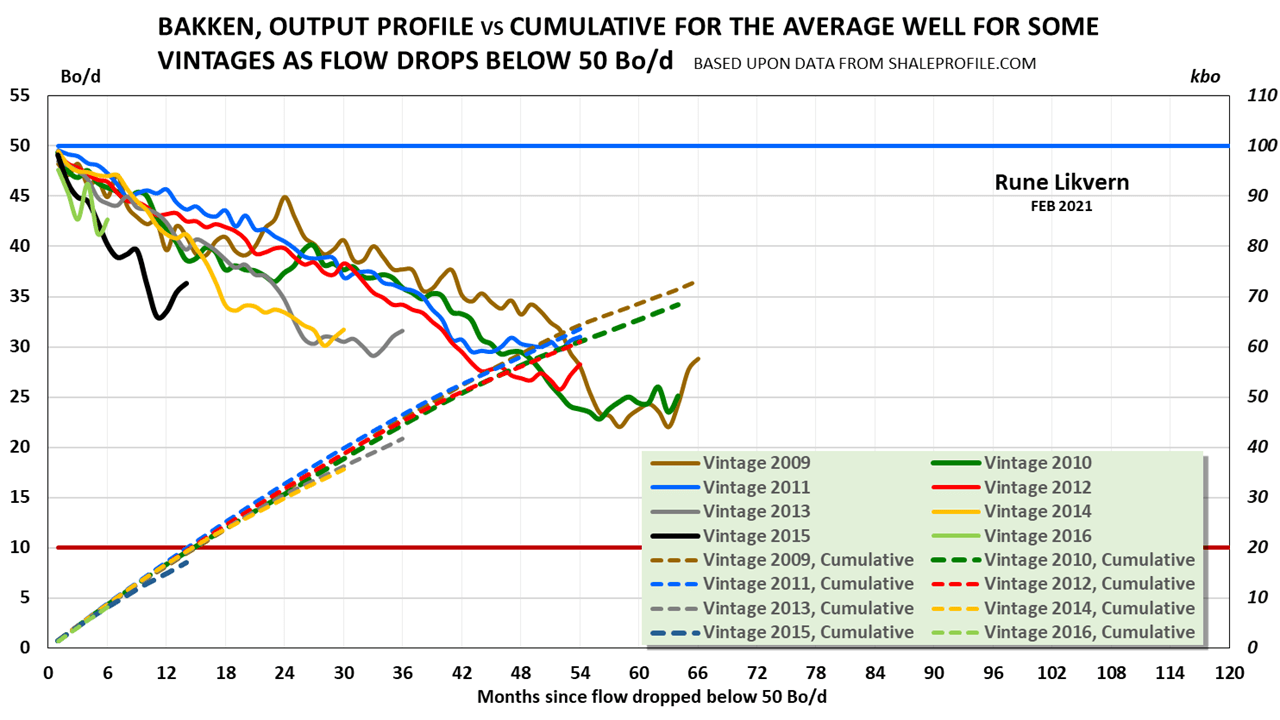
NOTE: The time scale for the chart has been rebased and starts with the first month with flow permanently below 50 Bo/d.
The 2009 vintage is on a trajectory for a cumulative of 110 kBo in phase 3 as it reaches a flow of 10 Bo/d.
The actual data shows the trend is for the younger vintages to use less time towards 10 Bo/d. The younger vintages have a higher decline and thus achieve a lower cumulative as these drops below 50 Bo/d until these reach 10 Bo/d.
The younger vintages, as from 2014, are now expected to have a cumulative of 60 – 75 kBo in phase 3.
To summarize, and based on the presented documentation, there is good reason to expect during what is referred to as phases 2 and 3, the cumulative for younger vintages will end up between 110 – 135 kBo.
The graph illustrates that the companies have succeeded in pulling a more significant portion of the extraction forward in time from improved well designs, more fracking stages, and the use of more proppants over the years. For the EURs used for the calculations above, refer to figure SD 10.
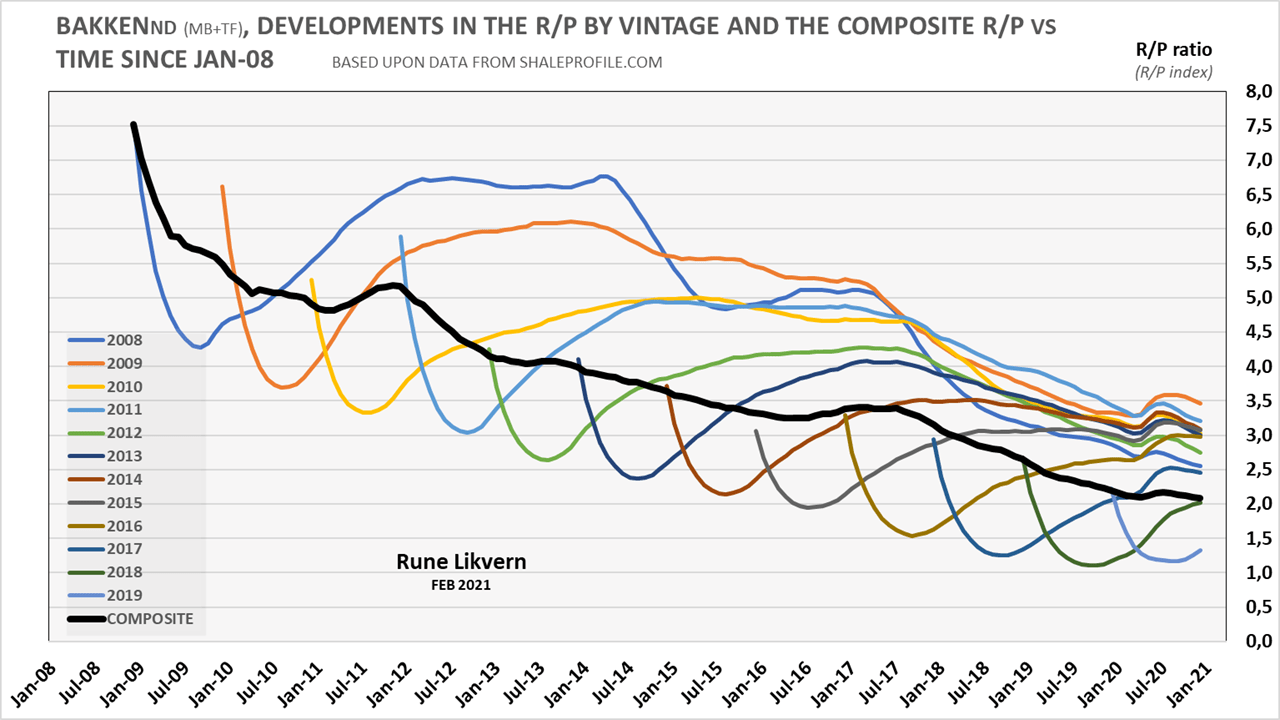
The composite R/P shows how the 12-month rolling total (annualized) R/P developed since Jan-09 and per Dec-20. There is a spread both in the quality of the wells and the portfolio of wells amongst companies. Using the composite R/P should be considered the first iteration to assess the companies’ remaining PDP reserves.
A company close to a scaled version (say 1:25) of the LTO developments, and its well portion is mirroring (1:25, or 4%) average vintage wells of the Bakken, an R/P of about 2,1 used in assessing the remaining PDP reserves should be expected from such a company’s SEC 10-K filing for 2020.
Figure SD 09 illustrates that for companies with a portfolio of wells dominated by older vintages, it raises the expectations for a higher R/P in the range of 2,5 to 3,0. Any R/P above 3 should prompt a more detailed analysis of the company’s well portfolio based on actual production data.
The R/P number gives a theoretical number of years the annualized production as of Dec-20 could be maintained with the estimated remaining PDP reserves.
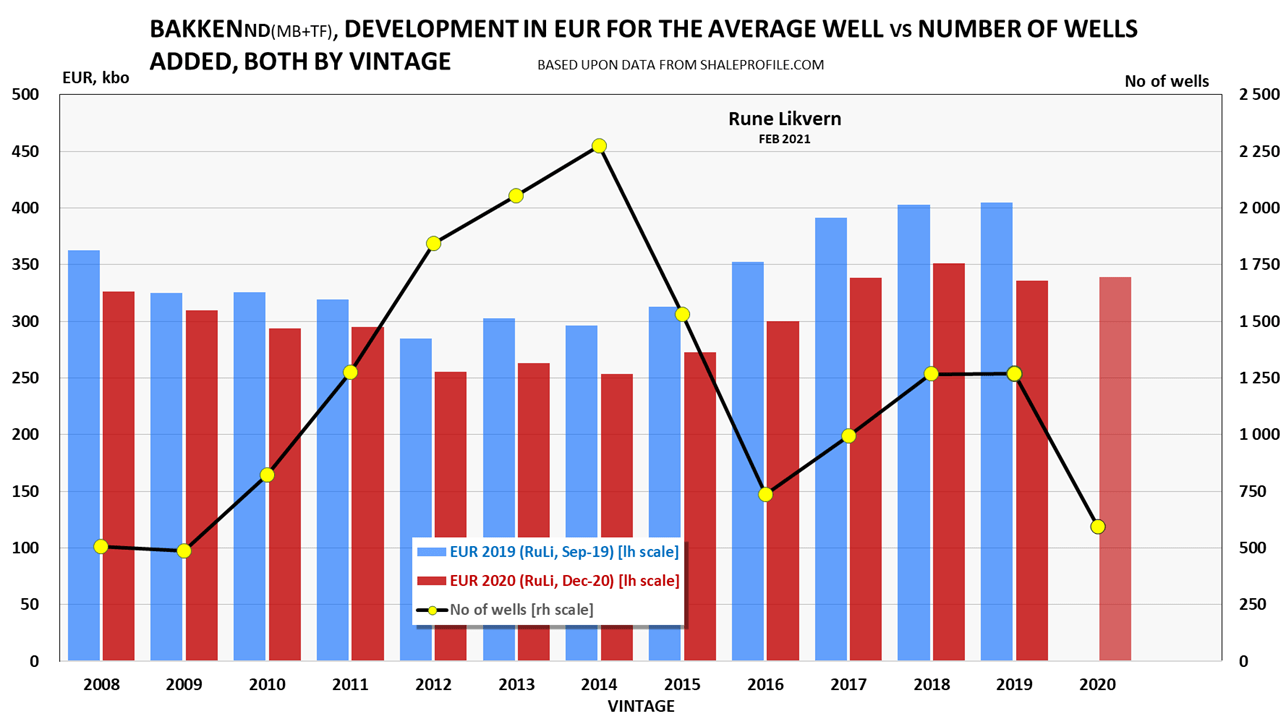
Figure SD 10: The chart shows the EURs for the average well by vintage used in this study. The blue columns are estimates performed in late 2019 based on actual data as of Sep-19, and the red columns are estimates performed in early 2021 based on data as of Dec-20, both left-hand scales. The yellow dots connected by the black line [rh scale] shows the number of horizontal wells started by vintage.
The chart shows that the newer estimates with more data points have been for lower EURs. Since 2014 there was a gradual improvement in the EURs resulting from improved well designs, more frack stages, and proppant usage. As of 2019, these productivity improvements have generally declined.
Typically more data reduce uncertainties, and for the EUR estimates, the rule was “follow the data wherever it leads.”

Copyright © Rune Likvern 2021. All Rights Reserved.
Written for: Fractional Flow
Abbreviations and Acronyms
Bo/d or bo/d, Barrels of oil per day
CAPEX, CAPital EXpenditures (costs, outlays)
CFO, Net Cash Flow from Operations
EUR, Estimated Ultimate Recovery, this is an estimate for potential recoverable oil and gas used to assess the profit/loss potential for a well or a field.
FCF, Free Cash Flow, customarily defined as operating cash flow minus CAPEX inclusive of dividend payouts.
GBo, Giga (billion) Barrels of oil
GOR, Gas Oil Ratio, customarily expressed as Scf/Bo or MScf/Bo.
IP, Initial Production (from a well)
kBo, kilo (1 000) Barrels of oil
LTO, Light Tight Oil
MBo, Mega (million) Barrels of oil
NDS, North Dakota Sweet is an oil quality, and its price at the wellhead has been used for the Bakken if not otherwise specified.
NGL, Natural Gas Liquids (primarily ethane, propane, and butanes)
NPV, Net Present Value (or Discounted Cash Flow, DCF), is the discounted annual net cash flow of some specified period. The discount rate or return is what alternative investments would yield.
PDP reserves, Proved Developed Producing reserves. PDP volumes are estimated recovered through existing wells with existing equipment and operating methods. All numbers of PDP reserves in this article are gross, if not otherwise specified.
R/P ratio (index) describes a theoretical number of years the estimated remaining reserves at some specified point in time [ T = 0] will last if extracted at an annualized rate at that specified point in time. This article uses a rolling 12-month total for annual extraction for R/P estimates.
RRR, Reserves Replacement Ratio (normally expressed in %), says something about companies’ abilities to replace extracted reserves over a calendar year. Generally, this estimate is over a calendar year, with the cut-off at the end of that calendar year. An RRR above 100% results in growth in reserves and below 100% a decline in reserves.
SEC, U.S. Securities and Exchange Commission
WTI, West Texas Intermediate

You must be logged in to post a comment.