In this post I present developments in world crude oil (including condensates) supplies since January 2007 and per July 2017.
In this post the world crude oil (inclusive condensates) supplies is split into three entities, North America [Canada, Mexico and the US], OPEC(13) and other Non OPEC [World – {North America + OPEC(13)}] with a closer look at Brazil.
For OPEC(13) a closer look at developments of number of active oil rigs versus developments in the oil supplies. This is supplemented with developments in the oil supplies versus the number of active oil rigs for some selected OPEC countries.
Looking at figure 07 for OPEC(13) the increase in its supplies as of late 2014/early 2015 followed a period with noticeable growth in oil rigs and likely capacity expansions/modifications of oil process/treatment facilities.
The accompanying increase in OPEC(13) supplies may simply have been rationalized from a pure business desire to recover the investments (CAPEX) from these capacity expansions.
Finally a closer look at developments in petroleum consumption/demand and stock changes for the Organization for Economic Cooperation and Development (OECD).
The OECD has about half of total global petroleum consumption and a major portion of the global petroleum stocks.
“It took a lot of costly oil to bring down the oil price. This is the magic from lots of cheap credit.”
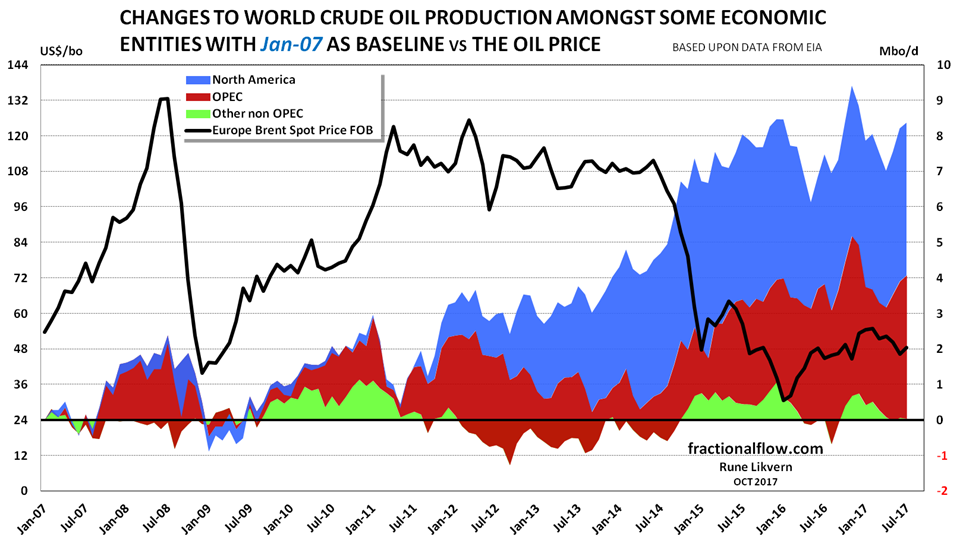
Figure 01: Figure 1: The stacked areas in the chart above shows changes to crude oil supplies split with North America [North America = Canada + Mexico + US], OPEC and other non OPEC [Other non OPEC = World – (OPEC + North America)] with January 2007 as a baseline and per July 2017. Developments in the oil price (Brent spot, black line) are shown against the left axis.It was the oil companies’ rapid growth in CAPEX leveraged by cheap debt [ref US Light Tight Oil (LTO)] and expectations of a sustained higher oil price that brought about a situation where supplies started to run ahead of consumption/demand that brought the oil price down. During the run up to the oil price collapse, supplies also grew from other non OPEC (ex North America) from developments sanctioned while the oil price was high and expected to remain so.
Following the oil price collapse several of these developments had to take considerable write downs.
This coincided with increased OPEC supplies in what became widely explained as a bid from OPEC for market share.
In the first part of this post I present an update on the profitability for Light Tight Oil (LTO) extraction in the Bakken (ND) as one big project.
This is followed with economic life cycle analysis for the average LTO well of the 2014, 2015 and 2016 vintages in the Bakken.
This analysis found that companies in aggregate continue to outspend net cash flows from operations and for 2017 this is now expected to total $2 – $3 Billion.
The strong growth and sustained high LTO extraction from the Bakken were facilitated by considerable amounts of debts. The growth in total debts outstanding (employed capital) continues to grow, albeit at a slower pace.
With oil prices sustained at present levels the total employed capital (primarily debt) constitutes severe obstacles for the profitability for the Bakken.
In a scenario where no wells were added post 2017 and the wellhead (at WH) price remained at $40/bo [~ $50/bo WTI] estimated losses for the project would be $20 – $22 Billion.
In a scenario where no wells were added post 2017 and the wellhead price remained at $60/bo [~ $70/bo WTI], the payout was reached after 7,5 years (in 2025) and the estimated return for the project becomes 3,5%.
With a sustained wellhead price at $74/bo [~ $84/bo WTI] post 2017, the payout was reached after 4,3 years (in 2022) and the estimated return becomes 7%.
What makes the profitability for the Bakken challenging are the number of years front loaded with negative cash flows.
So far the recent years improvements in flow and Estimated Ultimate Recovery (EUR) have not entirely caught up with the decline in and the sustained lower oil price.
For the average 2016 vintage well it was estimated that a sustained oil price of $53/bo at WH [~ $63/bo WTI] would return 7%. Figure 01: The chart above shows the estimated rolling 12 months totals [black columns] net cash flows. The red area shows the estimated cumulative net cash flow since Jan-09 and per Jul-17. LOE, G&A and interest rates (effective, i.e. adjusted for tax effects) based on a weighted average from several companies’ SEC 10-K/Q filings. Taxes according to what has been in force. Price of oil, North Dakota Sweet (NDS) and realized gas price as reported by several companies.
In the Bakken(ND) and since January 2009 and per July 2017 an estimated $100 Billion has been used for manufacturing operational LTO wells and at end July 2017 an estimated $35 Billion were outstanding to be recovered from the estimated remaining proven developed producing (PDP) reserves.
At the most CAPEX for well manufacturing in the Bakken out spent cash flow from operations at an annual rate of $9 Billion. For the Bakken there has been two distinct CAPEX cycles, the first in 2011/2012 while the oil price remained high, followed by another in 2015 after the collapse in the oil price.
The second cycle may have been rationalized by several factors like an expected rebound in the oil price, which OPEC (primarily its Middle East members) helped derail through their rapid increase in oil supplies starting in early 2015 in an (believed) effort to fight for market share. The second cycle may also have been rationalized by the incentive structure for management of LTO companies in which these were rewarded by volume growth over profitability.
Incurred costs for drilled, uncompleted wells (DUCs) and salt water disposal wells (SWDs) are not included. Directors cut for September 2017 listed 889 wells waiting for completion. Costs from any heavy and costly well maintenance/interventions are not included.
The DUCs represents $2,2 – $2,7 Billion in capital employed.
For the Bakken as one big project and the life cycle analysis the gross interest costs of 6% were reduced by 35% to reflect corporate tax effects.
Effects from hedges and from bankruptcy proceedings (debt restructuring) are not included.
Any arbitrage from the realized oil price adjusted for wellhead price, transport costs and any tax effects from this arbitrage are not included.
Some companies are now recirculating primarily borrowed money (at some interest) from the net operating cash flow and injecting additional capital to continue the manufacturing of new wells.
For some time I have explored the relations in developments for total debt [private and public], interest rates, Gross Domestic Product (GDP) energy consumption and thus also the oil price.
My theory has been that there are relations between changes to total debt and energy consumption and thus energy prices. Changes to total credit/debt should thus be reflected in energy consumption. Price formation is also influenced by several other factors and most prominently supply and demand balances.
To me, demand appears to be the one that is poorly understood and demand has been, is and will continue to be what one can pay for.
All transactions involving products and services require some amount of energy thus currency/money becomes a claim on energy.
During the last decades the world was in a gigantic experiment with debt expansion, most recently fueled by low interest policies which allowed to pull demand forward and for some time negate higher prices when demand ran ahead of supplies.
Debt expansions can go on until they cannot, as some economies already have experienced. In the recent decades, growth in total debt was higher than the growth in GDP (ref figure 1) and there is a strong relation between changes to total debt and GDP.
Figure 1: The chart above shows [stacked areas] developments in total private and public debt in Japan (black/grey), Euro area (yellow), US (blue) and China (red). In the chart is also shown [stacked lines] developments on the Gross Domestic Product (GDP) for the same 4 economies. NOTE: All data are market value, US$. The GDP (lines) have been stacked. The bottom line shows Japan, next is (Euro area + Japan) and the top line [China] also shows the total for the 4 presented economies. Data on private and public debt from Bank for International Settlements (BIS). Data on GDP from the World Bank [WB]. WB GDP data for 2016 were not publicly available as this was posted. Note that total GDP for these 4 economies declined from 2014 to 2015.In this post I also present a closer look at developments in energy consumption and total debts [private and public] for China, Italy, Japan, Spain, United Kingdom and USA.
As of 2016 these 6 countries had about 47% of the total global energy consumption and 42% of the total global petroleum consumption.
As the private sector debt growth slowed/reversed the public sector took over and it appears that public debt growth is not as potent to stimulate growth in energy consumption [and possibly GDP], but sustains or slows the decline in total energy consumption.
Part of the explanation for this may be that much of the increased public deficit spending is directed towards social programs (more unemployment benefits etc.) which at best may sustain demand.
The 6 countries are presented in the sequence of how I perceive how far they are into the debt deleveraging cycle.
There are other forces at play here as well, as oil companies entered into a bet that high oil prices would be sustained by consumers continuing to have access to credit/debt, which would allow the oil companies in an orderly manner to retire their steep growth in debts required to develop the costlier oil. The debt fuelled growth in investments gradually created a situation where supplies ran ahead of demand, thus collapsing the oil price in 2014.
To me the sequence of events is:
Changes in credit/debt => Changes in energy consumption => Changes in GDP


You must be logged in to post a comment.