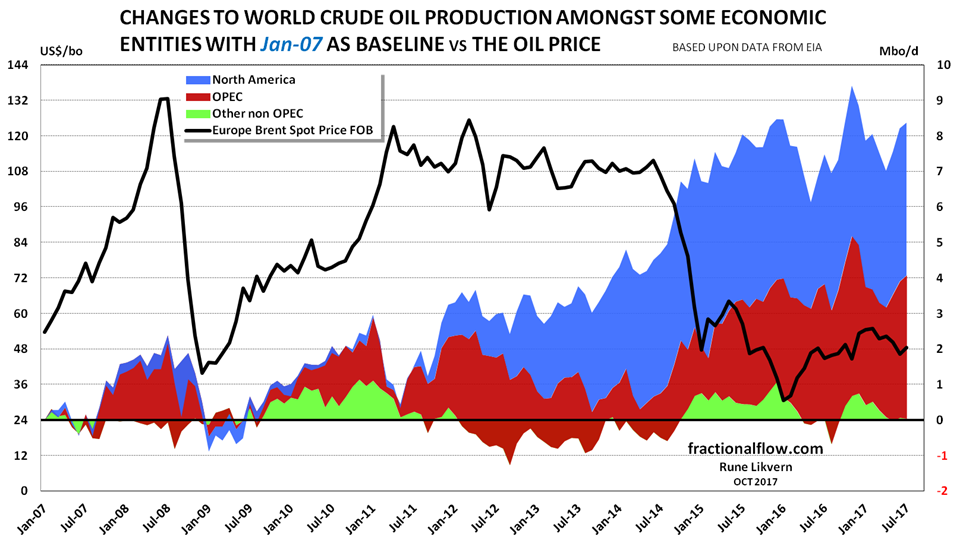
In this post I present developments in world crude oil (including condensates) supplies since January 2007 and per July 2017.
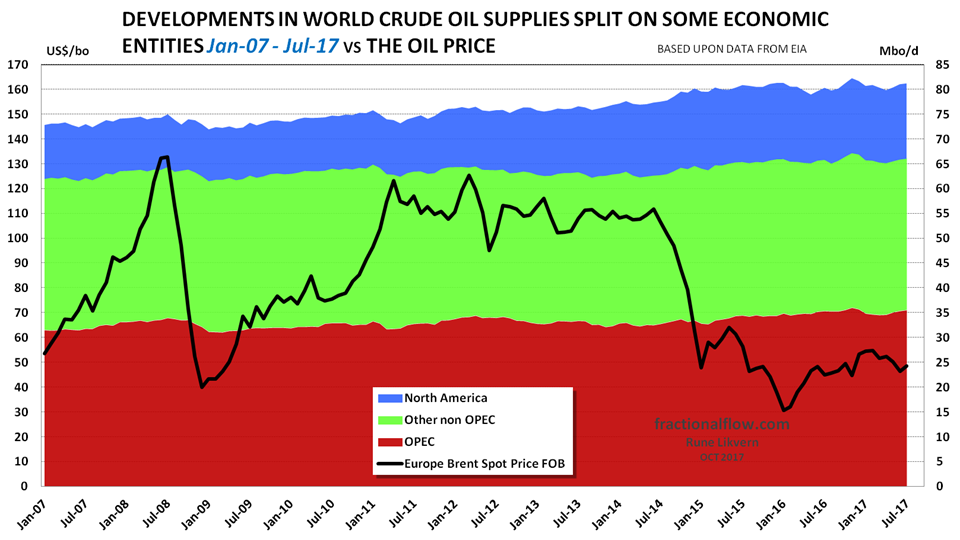
- In this post the world crude oil (inclusive condensates) supplies is split into three entities, North America [Canada, Mexico and the US], OPEC(13) and other Non OPEC [World – {North America + OPEC(13)}] with a closer look at Brazil.
- For OPEC(13) a closer look at developments of number of active oil rigs versus developments in the oil supplies. This is supplemented with developments in the oil supplies versus the number of active oil rigs for some selected OPEC countries.
- Looking at figure 07 for OPEC(13) the increase in its supplies as of late 2014/early 2015 followed a period with noticeable growth in oil rigs and likely capacity expansions/modifications of oil process/treatment facilities.
The accompanying increase in OPEC(13) supplies may simply have been rationalized from a pure business desire to recover the investments (CAPEX) from these capacity expansions. - Finally a closer look at developments in petroleum consumption/demand and stock changes for the Organization for Economic Cooperation and Development (OECD).
The OECD has about half of total global petroleum consumption and a major portion of the global petroleum stocks. - “It took a lot of costly oil to bring down the oil price. This is the magic from lots of cheap credit.”
Data from this post is primarily from EIA Monthly Energy Review October 2017.
Following the oil price collapse several of these developments had to take considerable write downs.
This coincided with increased OPEC supplies in what became widely explained as a bid from OPEC for market share.
Annualized and YTD 2017, only OPEC(13) has shown growth in crude oil supplies and this is after the agreed cuts was implemented as from the start of 2017.
As from the start of 2017 OPEC(13) put into effect an agreed cut in supplies of 1,2 Mbo/d together with some concessions (of about 0,6 Mbo/d, according to public figures, from some non OPEC countries) in an effort to accelerate the balancing of supply and demand and regain support for the oil price.
Libya and Nigeria were exempted from these cuts.
The CAPEX cycle created during the period with lasting high oil prices will towards 2020 continue to add capacity from a shrinking portfolio of sanctioned developments that remains in the pipeline. This is now believed to primarily offset decline from legacy production.
Any meaningful growth in the oil companies CAPEX (sanctioned developments, FIDs [FID; Final Investment Decision]) will require a sustained oil price above $60/bo.
As most developments take 2-4 years from being sanctioned to flow, this introduces a time lag as from when new sanctioned developments will add to supplies. The exception here is US LTO that has an edge due to its short response time.
Growth in oil supplies was a result from a lasting, high oil price also facilitated by the world’s major central banks low interest policies and fiscal deficit spending. Low interest policies allowed for an unprecedented growth in credit that supported both consumers (demand) and suppliers of oil.
A big portion of the oil companies’ portfolios of discoveries and infield/infill drilling that met the sanction hurdle of $60/bo were mostly expended while the oil price was expected to remain at or above $100/bo and the results from the recent years’ exploration has replaced a fraction of what was extracted.
World Crude Oil Supplies
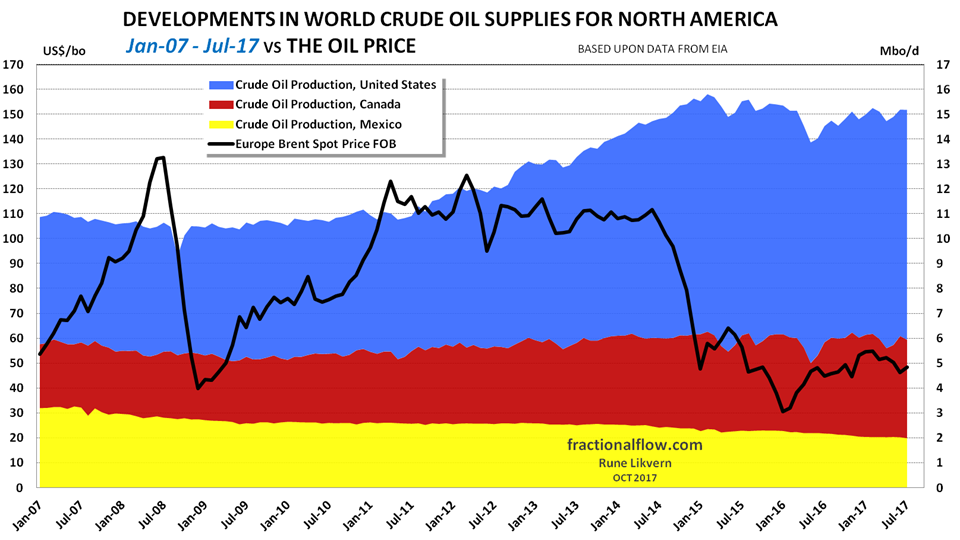
North America
Other Non OPEC
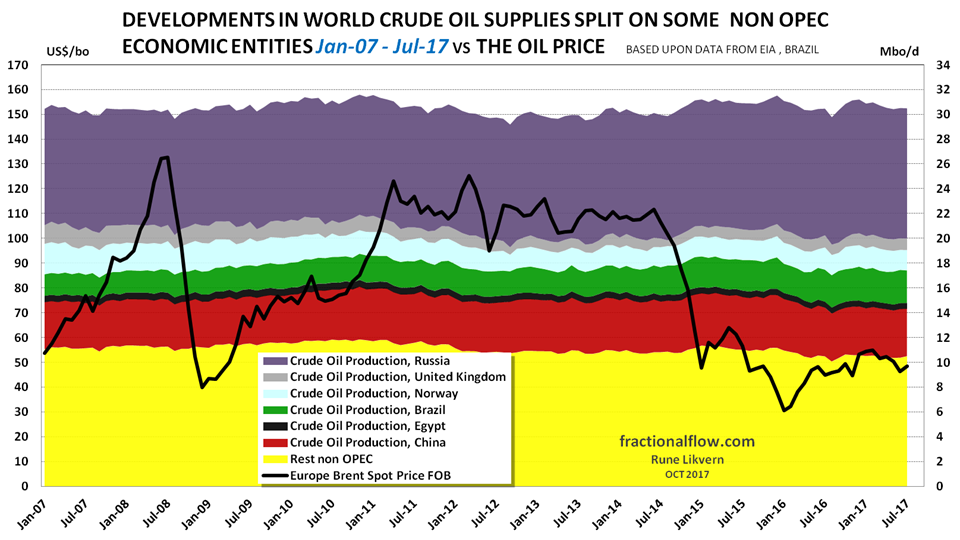
During late 2014/early 2015 the concerted efforts from this growth cycle in CAPEX came to fruition, the combined production of these other Non OPEC countries (ex Russia) started to grow in October 2014. These other Non OPEC countries (still ex Russia) reached a high in December 2015 of 21,2 Mbo/d and was down with more than 1 Mbo/d (4%) in July 2017.
Non OPEC had a high of 47,0 Mbo/d in December 2015 and was down to 45,7 Mbo/d by July 2017.
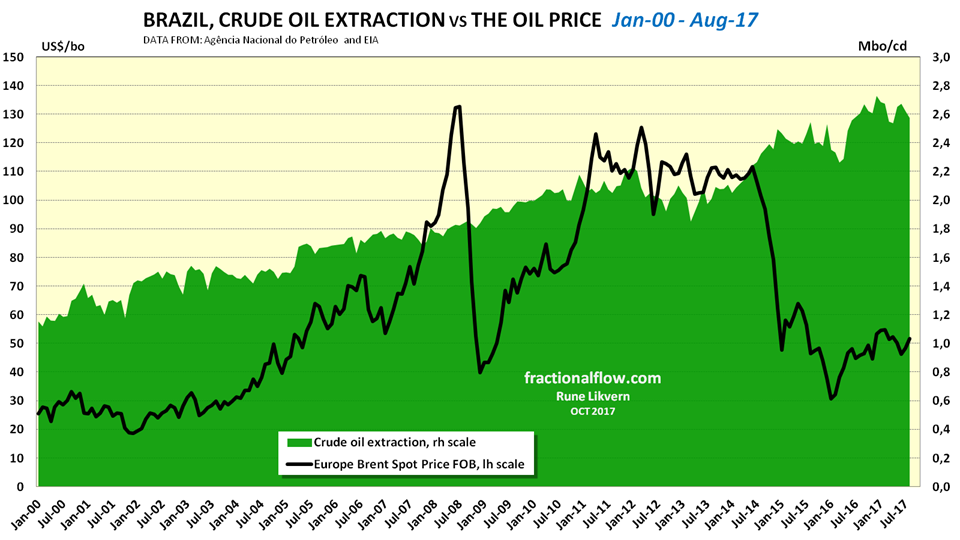
Brazil
Data for Brazil are from Agência Nacional do Petróleo.
OPEC(13) and the Oil Price
Equatorial Guinea became a member of OPEC(14) as of May 2017. EIA is as of now not reporting data on Equatorial Guinea.
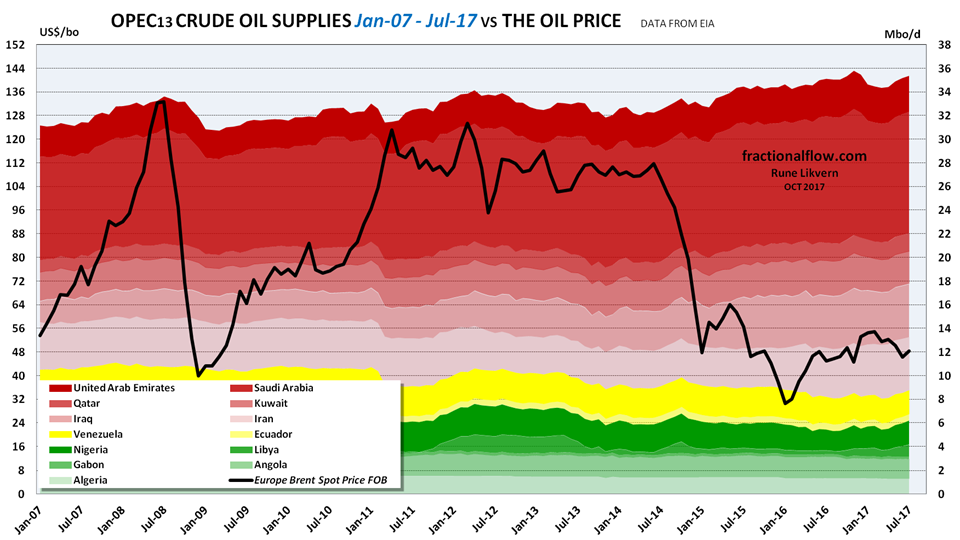
Figure 06 shows that just prior to and with the oil price collapse, OPEC(13) started to grow their oil supplies from 32,5 Mbo/d in June 2014 to 36,0 Mbo/d in November 2016.
In comparison, North America increased its supplies (crude oil and condensates) from 14,7 Mbo/d to 15,1 Mbo/d during he same period, with a high of 15,8 Mbo/d in February 2015, refer also figure 03. In July 2017 North America was at 15,2 Mbo/d.
Was the growth in oil supplies from OPEC a bid for market share or is the explanation, like for most other things, more complex (ref also figure 07 below)?
With the Libyan civil war, starting in February 2011, Libyan oil supplies collapsed and a tight supply situation became tighter and an already high oil price rapidly gained another $20/b, which it gave up as OPEC increased its oil supplies as of April 2011. Non OPEC, led by North America, started to grow its oil supplies as of October 2012.
By April 2012 OPEC reached a high as most of the Libyan oil supplies were temporarily brought back. This high was surpassed in June 2015.
The sanctions against Iran reduced its supplies about 1 Mbo/d from 2012 and until these were eased in 2016.
Iran now rivals Iraq in oil supplies.
OPEC had a high in oil supplies of 34,0 Mbo/d in July 2008 as the (monthly) oil price reached its apex and reached a new high with 36,0 Mbo/d in November 2016, more than 8 years later.
OPECs oil supplies in July 2017 was at 35,5 Mbo/d as Iran, Libya and Nigeria’s oil supplies totaled 0,9 Mbo/d more than in November 2016. That explains the recent uptick in OPEC oil supplies.
Libya and Nigeria (exempted from the cuts) have increased their supplies with a total of 0,7 Mbo/d since December 2016.
OPECs African and South America members have declined from 10,6 Mbo/d in 2010 and are now (re)growing towards 9 Mbo/d.
It will require a high oil price, considerable CAPEX and take some time to grow total supplies for OPEC members in Africa and South America to the levels of late previous decade.
OPEC(13) and number of Oil Rigs
The growth in no of oil rigs (ex Iran and Iraq) in OPEC was from about 170 in 2005 to an average of about 300 in 2014/2015.
Rig data from Baker Hughes.
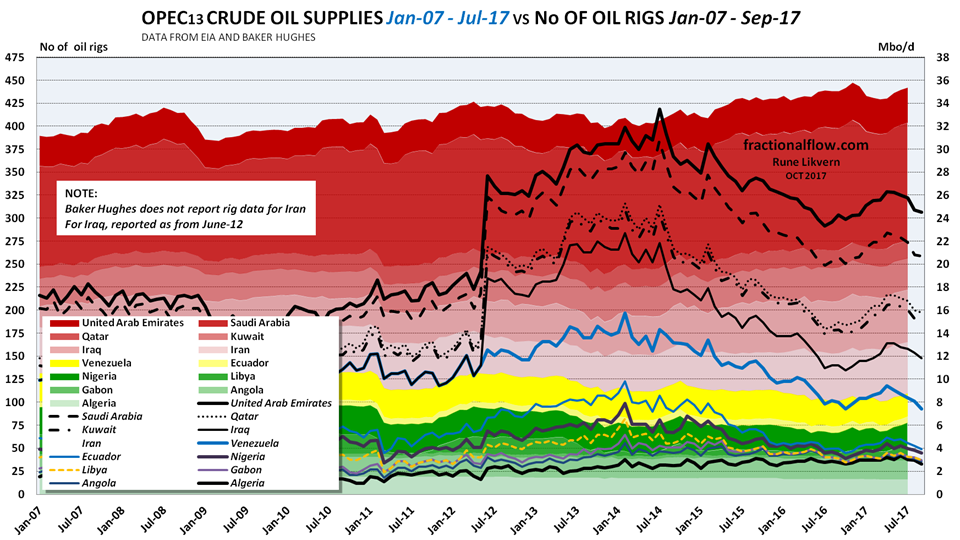
NOTE: Baker Hughes does not report rigs for Iran and for Iraq as of June 2012 (which explains the upward jump in June 2012).
Following the oil price collapse in the summer of 2014 the number of oil rigs within OPEC(13) dropped significantly while oil supplies, primarily from the Middle Eastern OPEC members, grew with about 4 Mbo/d from the summer of 2014 to end of 2016. Supplies were curtailed as agreed cuts were implemented as from 2017.
From June 14 to February 15 Iraq reduced their number of oil rigs from 96 to 56 which explains much of the sharp decrease in the number of oil rigs in OPEC.
OPEC oil supplies started a downward trend in June 2012, because of more above ground factors, this time sanctions against Iran. This while the number of oil rigs was increasing and the oil price remained high. By April 2014 this trend in oil supplies was reversed, and OPEC posted a steady growth in oil supplies of more than 2 Mbo/d until the recent agreed cuts were implemented following a period with a noticeably lower oil price.
Some selected OPEC countries
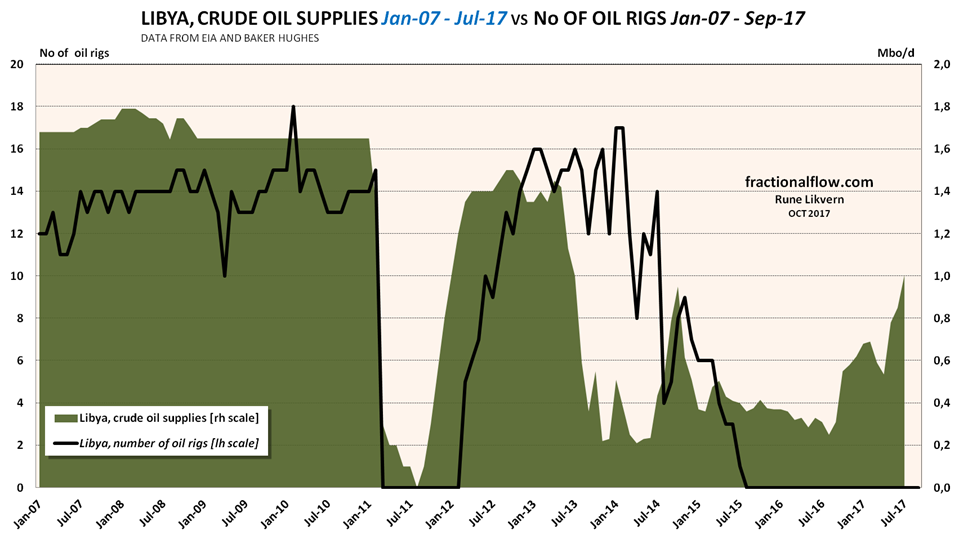
Libya has suffered from wars and social strifes since 2011 which also has affected its oil supplies.
Libya was above 1 Mbo/d in July 2017 and is from several sources expected to reach 1,2 – 1,3 Mbo/d in the near future. It is now believed that it requires operation of several oil rigs and some time before Libya again will reach oil supply levels prior to the war.
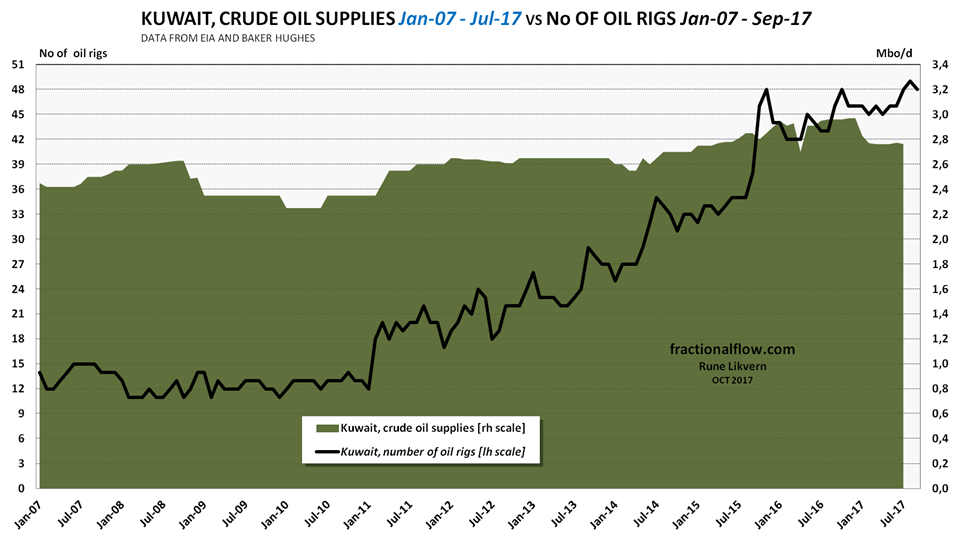
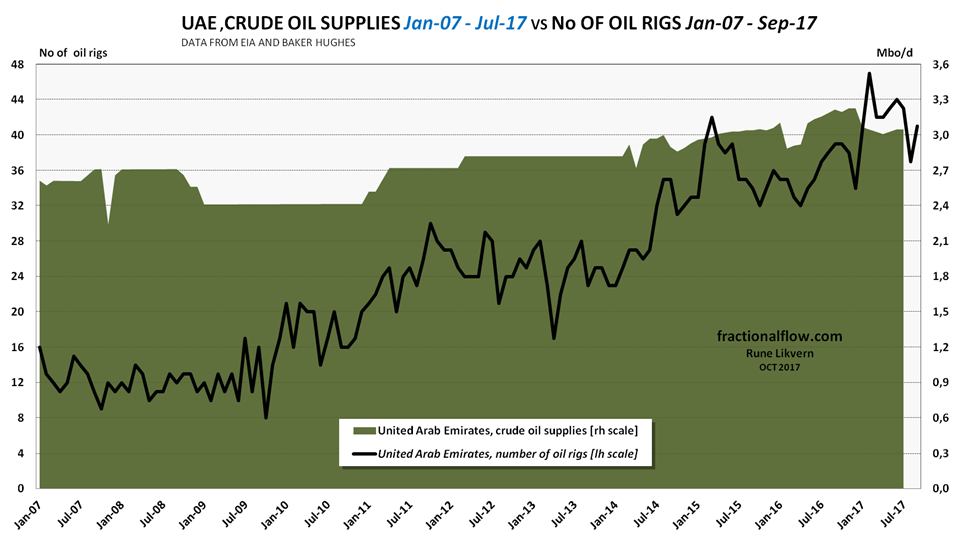
Looking at developments in oil supplies and the number of oil rigs, two OPEC members stood out, Kuwait and United Arab Emirates (UAE).
In 2005 Kuwait and UAE totaled about 30 rigs which grew to a recent total of about 90 while delivering noticeable growth in oil supplies post the oil price collapse. Note that the number of oil rigs remained high after the agreed OPEC cuts went into effect as of January 2017.
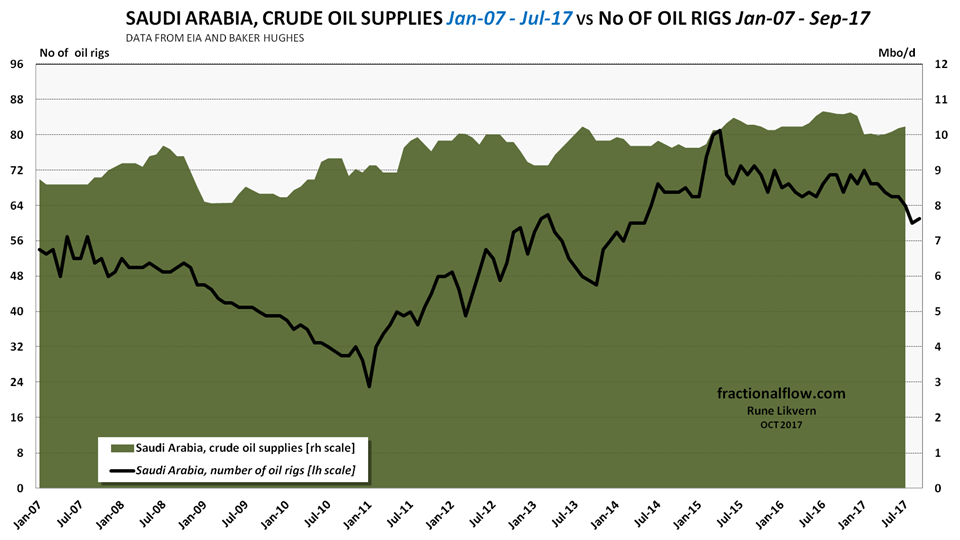
It appears, from looking at the number of oil rigs in Saudi Arabia, that it takes a high(er) number of rigs to sustain and grow oil production, and the number of oil rigs remained high as OPEC(13), led by Saudi Arabia increased its supplies with about 1 Mbo/d over a 2 year period post the oil price collapse.
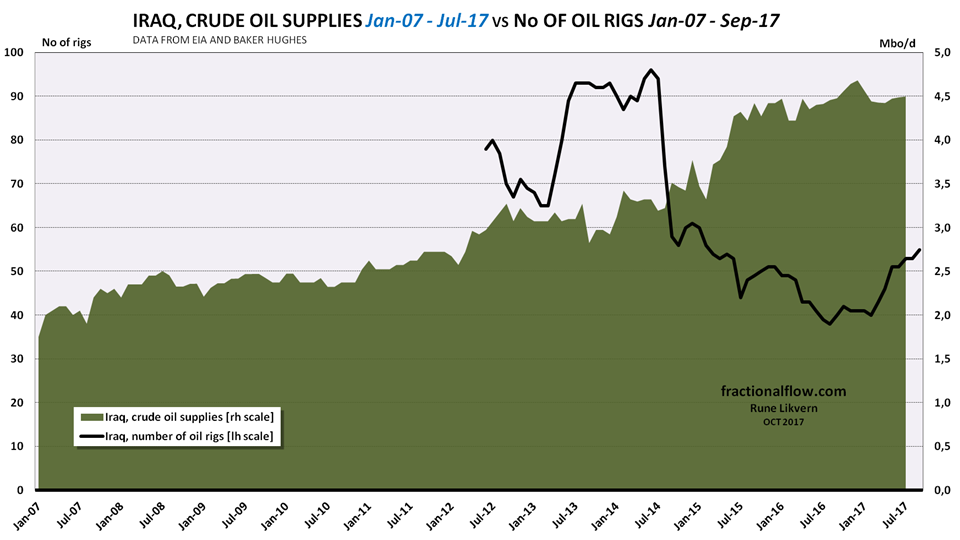
NOTE: Baker Hughes reports data on oil rigs in Iraq as from June 2012.
Developments in number of oil rigs in Iraq during the summer of 2014 is interesting as the significant drop in the number of oil rigs apparently coincided with the growth in OPEC supplies and the following collapse in the oil price.
The chart also illustrates that it required a considerable amount of active oil rigs to grow Iraq’s oil supplies.
OECD Petroleum Consumption
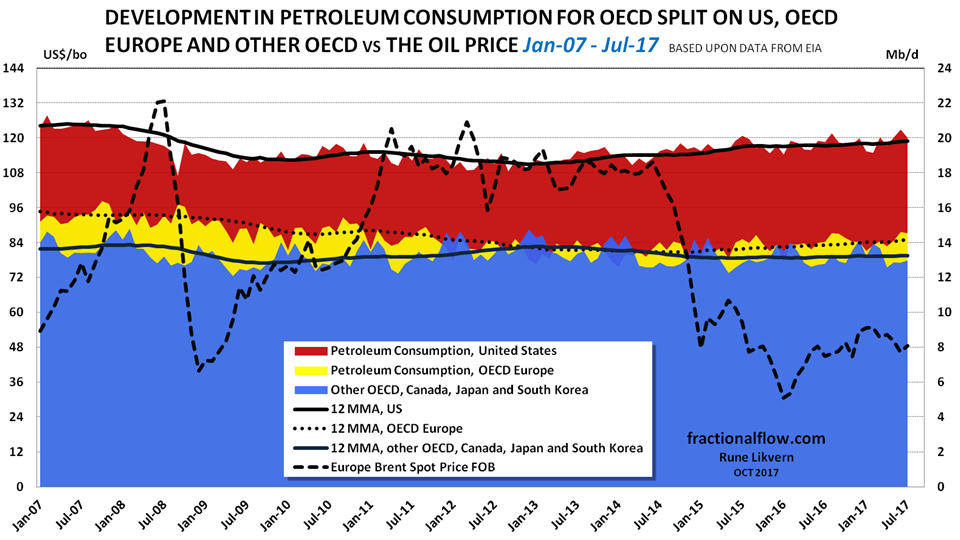
Japan has experienced a decline of about 10% in its petroleum consumption over the recent 3 years.
OECD petroleum stocks

As per July 2017 total OECD petroleum stocks were about 350 Mb over the 5 year average before the 2014 oil price collapse.
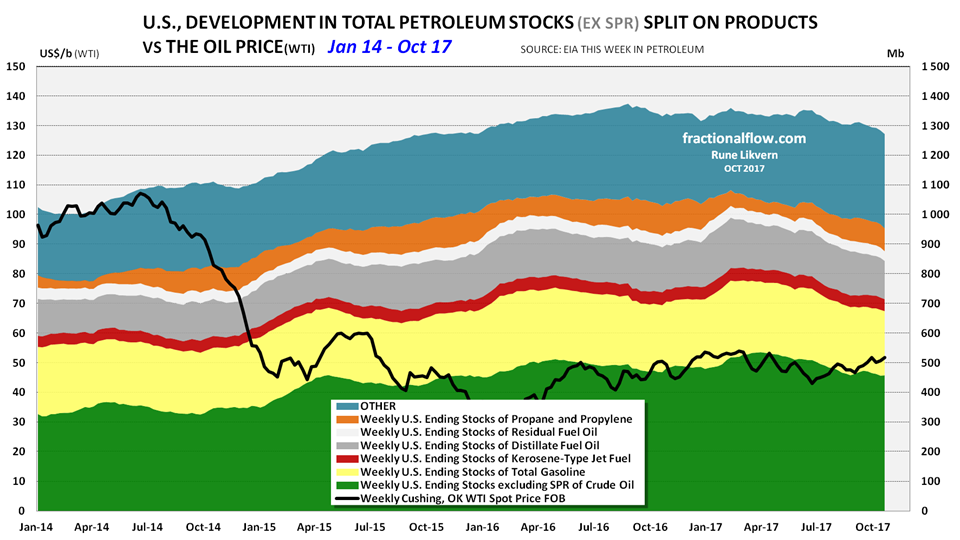
Developments in the oil price (WTI) are shown as a black line against the left hand scale.
In the US petroleum stocks has continued to decline and are now about 60 Mb lower than in June 2017, ref also figure 15 above. For the US it should be expected the data may still be subject to the effects of the aftermaths of the hurricanes that caused outages of production in Texas and Gulf of Mexico and refineries in the Gulf area.

You must be logged in to post a comment.