In this post I present developments in world crude oil (including condensates) supplies since January 2007 and per June 2016. Further a closer look at petroleum demand (consumption and stock changes) developments in the Organization for Economic Cooperation and Development (OECD) for the same period and what this implies about demand developments in non OECD.
The data used for this analysis comes from the Energy Information Administration (EIA) Monthly Energy Review.
- The OECD has about half of total global petroleum consumption.
- Since December 2015 OECD total annualized petroleum consumption has grown about 0.2 Mb/d [0.5%].
[Primarily led by growth in US gasoline and kerosene consumption, ref also figure 6.] - The OECD petroleum stock building was about 0.4 Mb/d during Jan-16 – Jun-16, which is a decline of about 0.6 Mb/d from the same period in 2015. This implies a 2016YTD net decline in total OECD demand of 0.4 Mb/d.
- World crude oil supplies, according to EIA data, have declined 1.3 Mb/d from December-15 to June-16, ref figures 1 and 2.
- The above implies that non OECD crude oil consumption/demand has declined about 1 Mb/d since December 2015.
This while the oil price [Brent Spot] averaged about $40/b.
This may now have (mainly) 2 explanations;
- The present EIA data for crude oil for the recent months under reports actual world crude oil supply, thus the supply data for 2016 should be expected to be subject to upward revisions in the future.
- Consumption/demand in some non OECD regions/countries are in decline and this with an oil price below $50/b.
If this should be the case, then it needs a lot of attention as it may be a vital sign of undertows driving world oil demand.
Oil is priced in US$ and US monetary policies (the FED) affect the exchange rate for other countries that in addition have a portion of their debts denominated in US$ thus their oil consumption is also subject to the ebb and flows from exchange rate changes.
![Figure 1: The stacked areas in the chart above shows changes to crude oil supplies split with North America [North America = Canada + Mexico + US], OPEC and other non OPEC [Other non OPEC = World - (OPEC + North America)] with January 2007 as a baseline and per June 2016. Developments in the oil price (Brent spot, black line) are shown against the left axis.](https://runelikvern.com/wp-content/uploads/2020/05/2f3c2-fig-1-world-crude-oil-relative-to-jan-07.png)
YTD 2016, only OPEC has shown growth in crude oil supplies relative to 2015.
Unit costs ($/b) to bring new oil supplies to the market is on a general upward trajectory while the consumers’ affordability threshold may be in general decline.
In this post I have introduced the concept of “consumers’ affordability threshold”, and with that I mean as crude oil prices start to grow, overleveraged consumers are likely to respond by reducing their consumption.
OPEC, primarily Libya and Nigeria, could add more than 1 Mb/d to global supplies in the near future.
[Added OPEC supplies may cancel out declines from other oil producers and provide some temporarily growth in global oil supplies. This will likely prolong the period with depressed prices.]
- The oil companies CAPEX reductions will continue through 2017 and flow additions from sanctioned developments will gradually decline towards 2020.
- Any meaningful growth in oil companies CAPEX (sanctioned developments, FIDs [FID; Final Investment Decision]) will require a sustained oil price above $60/b.
[As most developments take 2-4 years from being sanctioned to flow, this introduces a time lag for when new developments will add to supplies.]
A big portion of oil companies’ portfolios of discoveries and infield drilling that met the sanction hurdle of $60/b were mostly expended while the oil price was expected to remain at $100/b or above and the results from recent years’ exploration has replaced a small portion of what was extracted.
World Crude Oil Supplies
![Figure 2: The stacked areas in the chart above shows development in crude oil supplies split on some economic entities from January - 07 and per June -16. The oil price [Brent spot] is shown against the left axis.](https://runelikvern.com/wp-content/uploads/2020/05/19d1c-fig-2-world-crude-oil-by-some-entities-since-jan-07.png)
![Figure 3: The stacked areas in the chart above shows relative development in crude oil supplies split on some economic entities from January - 07 and per June -16. The oil price [Brent spot] is shown against the left axis.](https://runelikvern.com/wp-content/uploads/2020/05/703b9-fig-3-world-crude-oil-relative-development-since-jan-07.png)
OECD Petroleum Consumption
![Figure 4: The chart above shows development in petroleum consumption for the US [red area], OECD Europe [yellow area], and other OECD (which includes Canada, Japan and South Korea) [blue area]. The chart is complemented with lines showing smoothed 12 month moving averages (12 MMA) for the presented OECD countries/regions. The oil price (Brent spot) is shown against the left axis.](https://runelikvern.com/wp-content/uploads/2020/05/816e4-fig-4-oecd-petroleum-consumption-developments.png)
Japan has reduced their petroleum consumption with about 10% since the oil price collapsed.
OECD Petroleum Stocks
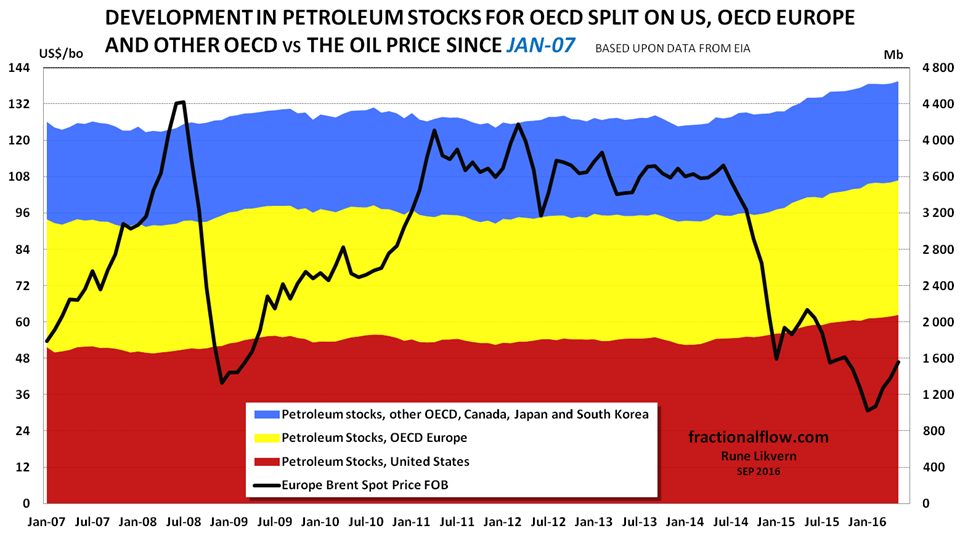
As supplies in 2014 started to run ahead of consumption the oil price collapsed that allowed for a strong stock build in OECD (ref also figure 5) and in China according to some reports.
More than 330 Mb has been added to OECD stocks since January 2015.
The high stock levels will for some time act to temper growth in the oil price.
A closer Look at Developments in US Petroleum Demand
![Figure 6: The chart above shows development in annualized [52 weeks moving averages] US total petroleum consumption [blue line] and storage build [red line] both rh scale. The black line, lh scale, shows development in the oil price (WTI). Consumption and storage developments are relative to Janaury 2014 (baseline). NOTE, changes in consumption and stocks are stacked, thus the red line also shows total annualized changes in demand.](https://runelikvern.com/wp-content/uploads/2020/05/87b33-fig-6-us-petroleum-demand-developments.png)
NOTE, changes in consumption and stocks are stacked, thus the red line also shows total annualized changes in demand.
- EIA data show that US total demand has moved sideways since Sep-15 with a noticeable growth in consumption (lead by gasoline and kerosene) and slower growth in stocks building (ref also figure 7).
![Figure 7: The chart above shows development in US commercial stocks of petroleum, by some products, since Jan-14 [stacked areas, rh scale] together with the development in the oil price (WTI) [black line, lh scale].](https://runelikvern.com/wp-content/uploads/2020/05/96719-fig-7-us-commercial-petroleum-stocks-developments.png)
![Figure 8: The chart shows Year over Year (YoY) growth in private and public debt for the world's 2 biggest economies, the US [blue line] and China [red line] and their total [black line] from Q1-2000 and as of Q1-2016.](https://runelikvern.com/wp-content/uploads/2020/05/6eef9-fig-8-china-and-us-private-and-public-debt-since-2000.png)
So where is the Oil Price headed?
With the oil price at $100/b the oil companies leveraged up with debt expecting this to be the new normal. The collapse in the oil price in 2014 presented them with a new reality which many now struggle with to understand what means for the future price formation for oil.
I have several times written that the oil price has also very much been a function of monetary and fiscal policies and thus provides an important part of the foundations for how its D E M A N D develops. Oil is now not priced for the utilities it provides for societies, but just as another commodity. O I L D E M A N D developments still appear to be the variable that remains poorly understood.
If as present EIA data suggest that crude oil demand in non OECD is in decline with an oil price below $50/b this may signal something about a shift in structural affordability which (with some time lag) also will affect the OECD.
Affordability is more related to price than costs. The median household has experienced little or no growth in purchasing power relative to developments in other expenses like debt service/rent and health care. This is important as this suggests that their affordability threshold for higher priced oil likely is in decline. This may be hard to verify with an oil price below $50/b, but (and if I am right) will materialize itself in a decline in consumption as the oil price starts to move up.
This is where I expect that for some time the oil price will enter the affordability dynamics, as prices starts to move up consumption/demand in response will decline thus curbing any price growth.
This will create some interesting dynamics as oil companies bet their future on sustained higher oil prices and a “lower for longer” prolongs the time it takes to heal their balance sheets and defers necessary CAPEX in exploration and developments to meet projected future demand.
The continued stock builds (in petroleum) suggests that there is still some way to go before supplies reaches a level where the oil price regains fundamental support for growth. One of the parameters I keep an eye on is how petroleum stocks develops and I am not thinking about movements from one week to another, but more like when commercial stock draw downs over some time (and seasonally adjusted) declines and permanently remains 5% (or more) below present levels.
On the supply side there is potential for growth of several OPEC members like Iran, Libya and Nigeria.
Bringing on additional supplies (wherever from) will prolong the time with suppressed price growth.
For anyone out there trying to predict the future oil price trajectory to what extent is the effects (or lack of) from future central bank’s policies, governments’ fiscal policies, bank leverage and risks to financial stability, the state of Chinese banks and monetary policies, Chinese oil demand, including the filling of their SPR [Strategic Petroleum Reserve], developments in world trade, just to name a few, factored in?

Interesting – as always.
I agree that demand (influenced by central bank policies) is likely to be very important for the future trajectory of the oil price. However, depletion never sleeps. It seems to me that we may be facing a perfect storm in a not so distant future (2020 the latest?). Low growth (and prices) will probably deter big investment projects for several more years. But, look at the projects that are in “the pipeline” – from 2018 onwards production seems to decline several Mb/d. Even in a zombie economy that is a huge drop. Unless the world economy falls off a cliff I can’t see how a price spike is to be prevented.
LikeLike
Hello and thanks!
I also expect production potential to decline and as you point out depletion never sleeps.
What is hard to predict is the relative movements between consumption/demand and production.
Japan reduced their oil consumption with 10% since June 2014 and this as the oil price collapsed and remained low. Some of it may be due to a combination of substitution (LNG?) and efficiency gains.
Not before the oversupply and excess reserves gets noticeably reduced the situation will allow for sustained support for a higher oil price.
If production for some reasons in the near future gets significantly reduced over some time a price spike could happen.
LikeLike