In this post I present actual Norwegian natural gas production, status on reserves, the development in discoveries and what this results for Norwegian Petroleum Directorate (NPD) and my expectations for the future delivery potential for Norwegian natural gas.
Norway, after Russia, has been and is the EU’s second biggest supplier of natural gas.
Norway is the third largest gas exporter in the world. In 2015, Norway exported about 114 Gcm (Bcm) gas, mainly to other countries in Europe.
Included is also a brief look at developments in actual consumption and production of natural gas in the 28 members of the European Union (the EU 28).
- NPD in their most recent forecast further revised down and narrowed their band for future delivery potential with about 10 Gcm/a (Bcm/a) by 2025 and pushed forward the start of decline one year relative to their previous forecast.
- I now expect the Norwegian delivery potential for natural gas relative to 2015 to decline by more than 40% by 2025.
- Europe will increasingly have to rely on natural gas imports from more distant sources and should by now have defined policies for the role natural gas will have in its future energy mix.
This post is an update to my post in 2015 looking at the status as of end 2014.
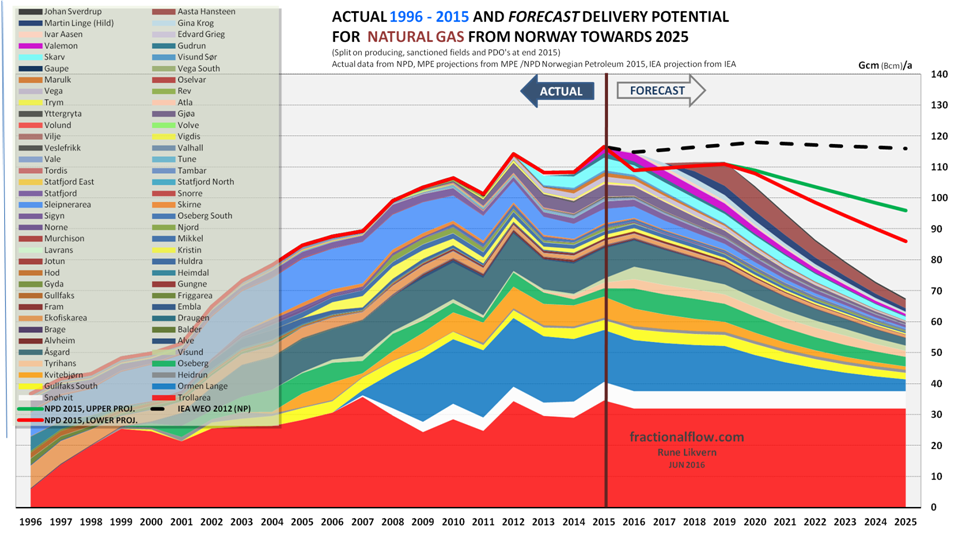
The chart also shows the band of NPD forecasts; green line upper projection, orange line lower projection. NPD’s central projection is in about the middle of the green and orange lines.
The black dotted line is the forecast from the International Energy Agency’s World Energy Outlook 2012 (IEA WEO 2012).
Numbers are believed to be gross exports from the production installations and thus not adjusted for “shrinkage” from Natural Gas Liquids (NGL) extraction, primarily at Kollsnes and Kårstø. The NGL extraction reduces total sales gas volumes with around 4% relative to what is exported from the producing installations.
Numbers in Gcm, Giga cubic meters (Gcm = Bcm; Billion cubic meters)
My forecast and NPD’s forecast at end 2015 are basically identical towards the end of this decade, but differs about the timing for the start of the decline and how steep this will become as from early next decade. My forecast is also tested versus the Reserves over Production (R/P) ratio as of end 2015, refer also figure 2.
At end 2015 the NPD projection of Norwegian natural gas supply potential towards 2025 was revised down.
Beyond 2025 Troll and Snøhvit (LNG; Liquified Natural Gas)) are likely to be the backbones of Norwegian natural gas supplies.
Norwegian natural gas deliveries had a high in 2015.
I prefer to use the term delivery potential as there may be bilateral departures from contracts dictated by swings in demand, and the winter’s weather is the big moderator for gas demand. The Troll field is operated as a swing producer to take the brunt of swings from buyers’ demand.
Start up of Aasta Hansteen has been pushed back to H2 2018 and its profitability is linked to developments of other discoveries in the Norwegian Sea, like Linnorm, Victoria and Zidane (total EUR of 70 Gcm [Bcm]).
The Forecast expressed by the R/P Ratio
The R/P (Reserves divided with Production) ratio for a specified year provides a snapshot for how many years the estimated reserves at the end of that specified year theoretically can be sustained.
The R/P snapshot also serves as a valuable test (as close to a verification the most recent data allows) on the realism of the forecast in figure 1.
![Figure 2: The chart above with the stacked boxes shows the R/P ratio for the fields with meaningful rates of natural gas extraction and the rest have been lumped together with others [brown box]. The sum of the areas of the boxes represents total estimated remaining gas reserves for NCS as of the end of 2015. The chart also shows NPD’s recent forecast towards 2020, my forecast towards 2025 and IEA WEO’s 2012 forecast towards 2035.](https://runelikvern.com/wp-content/uploads/2020/05/6342f-figure-2-norwegian-natural-gas-production-expressed-by-reserves-over-production-ratio.png)
With time the area of the boxes, primarily height, will shrink reflecting the depletion of the reservoirs.
The R/P approach shows that for all practical matters NPD’s and my forecast (I refer to potential) towards 2020 are identical.
The chart illustrates that beyond 2019 there is a rapidly growing divergence between the IEA WEO 2012’s and my forecasts.
As of now the reserves and production data from NPD lends no support for IEA’s expectations for the level of Norwegian natural gas deliveries towards 2035.
Development and Status of Norwegian Natural Gas Reserves

The chart also includes a table that shows the year of discovery for fields estimated to hold more than 100 Giga cubic meters (Gcm = Bcm; Billion cubic meters) of recoverable natural gas.
The chart illustrates that the biggest discoveries were made early in the exploration phase and after the discovery of Ormen Lange in 1997, more natural gas was produced than discovered. Many of the recent discoveries are relatively small, in deep water and thus requires a high gas price to become sanctioned for commercial developments.
The chart illustrates that Norwegian natural gas extraction has been in liquidation since the late 1990’s.
![Figure 4: The chart above shows NCS discoveries, their estimated recoverable crude oil reserve versus natural gas reserves and their evaluation status. It is the total petroleum reserves, their location and potential for coordination [including the use of existing infrastructure] that form the economic basis for any developments. Due to scaling the chart does not include Johan Sverdrup [under development] and Johan Castberg (Barents Sea).](https://runelikvern.com/wp-content/uploads/2020/05/1eca8-figure-4-norwegian-natural-gas-vs-crude-oil-discoveries-per-2015.png)
Due to scaling the chart does not include Johan Sverdrup [under development] and Johan Castberg (Barents Sea).
- Individually hey are too small to have a meaningful impact on the forecast for the potential of total Norwegian natural gas supplies towards 2025
- Some of these are time critical, meaning that any cost benefits from the use of existing infrastructure expires as these reaches their end of their economic life and are closed down. To make these discoveries commercially viable post such close downs requires primarily a higher price.
One way to describe these discoveries is that as time goes, these risks becoming commercially stranded.
Where Norwegian Natural Gas is exported to

In 2015 Netherlands increased their imports of Norwegian gas as their annual output from the Groningen gas field which had supplied about 54 Gcm [Bcm] in 2013, [scroll down] was lowered to 27 Gcm. This due to earthquakes linked to production.
Dutch government lowers Groningen gas output cap to 24 bcm
A brief Look at (EU + Norway)’s actual Natural Gas Supplies and Consumption
With the prospects of a near future decline in Norwegian natural gas supplies and indigenous European supplies in general decline, Europe needs a plan about natural gas role in its future energy mix.

Pipelined imports are primarily from Russia and North Africa (Algeria and Libya). In recent years, most LNG has come from Qatar, Algeria and Nigeria.
The forecast for EU+ Norway production reflects the recent curtailment from the Goningen gas field in the Netherlands.
The forecast for EU’s natural gas consumption towards 2025 (dotted black line) is based on EUs projections.
EU + Norway natural gas supplies peaked in 2004 and EUs natural gas consumption has declined about 100 Gcm (about 20%) from its likely peak.
Inasmuch historical data on European pipelined and LNG imports provide any guidance for the capacities of these import systems, it now appears that by early next decade the capacities of the import systems are in much need for expansions to sustain present European natural gas consumption levels.
To sustain present levels of natural gas consumption in Europe a projected 100 – 150 Gcm/a additional supplies are needed by 2025. As of now and given the time frame involved, there are few suppliers in Europe’s proximity that has the potential to provide meaningful supplies to help close an emerging and growing gap in natural gas supplies.
Here I presented a closer look at Norwegian crude oil production based on NPD data at end 2015.

One thought on “Status of Norwegian Natural Gas at end of 2015 and Forecasts towards 2025”
Comments are closed.