In this post I present some of the methods I have used to get estimates based on actual NDIC data on the Estimated Ultimate Recovery (EUR) for wells in the Bakken North Dakota.
The Bakken is here being treated as one big entity. As the Bakken shales [for geological reasons] are not ubiquitous there will be differences amongst pools, formations and companies.
One metric to evaluate the efficiency of a Light Tight Oil (LTO) well and a large population of wells are looking at developments in the Reserves over Production (R/P) ratio.
The R/P ratio is a snapshot that gives a theoretical duration, normally expressed in years, the production level for one particular year can be sustained at with the reserves in production at the end of that year.
Further, as LTO wells decline steeply and a big portion of the total extraction has come/comes from wells started less than 2 years ago, this dominates the Reserves/Production (R/P) ratio. The flow from a big population of high flowing wells in steep decline results in a low R/P ratio (and vice versa).
The R/P metric says nothing about extraction in absolute terms, which is another metric that needs to be brought into consideration in order to obtain a more complete picture of expected developments.
Development in Well Totals by Categories
![Figure 1: In the chart above the about 10,000 wells with 12 months of flow or more [started as of Jan-08 - Jul-15] has been split into 5 categories [ref the legend] and the average monthly flow versus total [for the average] has been plotted for each category. Cut off has been made after 72 months (6 years) as the declining number of wells over time makes the calculations susceptible to noise like from refracking in the tail and because of a declining well population. This method makes it possible to identify the EUR trajectories for each category of wells. The average well in the Bakken now follows a trajectory 2-4% below the green line [wells above 75 kbo and less than 100 kbo after the first 12 months of flow]. The colored dotted lines [sloping upwards to the right] connects each category after the first 12, 24, 36, etc months of flow.](https://runelikvern.com/wp-content/uploads/2020/05/7edac-fig-1-bakken-cumulative-vs-monthly.png)
This method makes it possible to identify the EUR trajectories for each category of wells. The average well in the Bakken now follows a trajectory 2-4% below the green line [wells above 75 kbo and less than 100 kbo after the first 12 months of flow].
The colored dotted lines [sloping upwards to the right] connects each category after the first 12, 24, 36, etc months of flow.
Estimates done by others based on actual NDIC data puts now the EUR for the average Bakken well slightly below 300 kbo.
As from what point the wells reach the end of their economic life, educated guesses now spans from 10 bo/d (0.3 kbo/Month) to 25 bo/d (0.75 kbo/Month).
Formatted NDIC data kindly made available by Enno Peters, who operates the site shaleprofile.com which has a great number of charts based on actual data sorted on wells by shale plays, companies and much more to be explored.
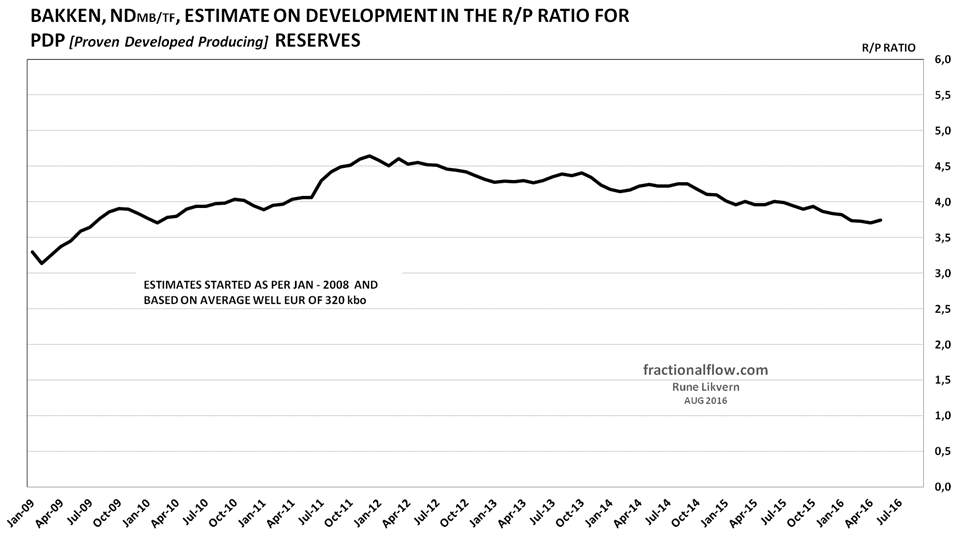
NOTE: The R/P ratio gives no information about the extraction level.
Simplistic explained the chart illustrates that the rapid growth in producing wells, until the oil price collapsed, did little to increase the R/P ratio. The debt fueled increase in wells did for some time grow production, but due to the steep decline rates of LTO wells it did little to how long the obtained level could be sustained.
If no wells were added post Jun-16, this would materialize itself by a continued decline in the extraction while the R/P ratio slowly grew, likely towards 8-9, before it declines.
Simplistic explained an LTO well drains a theoretical horizontal cylinder with the production string in its center.
One of the main objectives in the design of LTO wells is to recover the oil within this “cylinder” as fast as possible while practicing good reservoir management. The companies want to recover their investment as fast as possible (reach payout) and start making a profit.
Drilling, completing and starting wells allow the companies to book reserves both as Proven Developed Producing (PDP) and Proven UnDeveloped (PUD). The more wells that are drilled and started the more reserves can be booked.
Reserves are one of the important parameters that are used for assets/equity estimates and for PV10 (standardized measure of discounted future net cash flows) by the companies and THE major physical property that is used as collateral for assuming debt.
Studying the SEC 10-K filings for several public companies which major oil production (more than 90%) comes from the Bakken, it was found that their R/P ratios at end 2015 was in the range of 6 – 10.
The SEC estimates of reserves apply some risk adjustments which make these conservative with the objective to shield investors and creditors.
It is worth noticing the difference in the R/P ratio of about 4 for the Bakken derived from applying actual data to that of 6-10 derived from companies SEC 10-K filings.
Compare this to an R/P ratio of about 7 for all conventional reservoirs [which has slower declines] that were flowing at end 2015 on the Norwegian Continental Shelf (NCS) based upon data from the Norwegian Petroleum Directorate (NPD).

Refer also to the text in figure 2 in this post for more about the assumptions used for the estimates presented in figure 3 above.
Allowing for some margin (due to exclusion of hedges, natural gas and NGLs to name some) the Bakken in recent months has for all practical reasons been cash flow neutral.
The operators are now netting back a total of around $400 M/Month (with WTI at $47/bo), or in the neighborhood of $5 B/a.
The estimates do not include income from sales of natural gas and NGLs (Natural Gas Liquids) which during the last 2 years has come at a loss of $2-$3/Mcf. [1 bo LTO comes now with about 1.6 Mcf.]
Just to retire estimated total debts (about $36 Billion, including costs for DUCs, SDWs, excluding hedges and income/loss of natural gas and NGLs) would require about 7 years with extraction and prices at Jun-16 levels.
Estimated remaining reserves support [theoretically; ref the R/P ratio in figure 2] about 4 years at present extraction levels, thus the (average) oil price need to become higher to allow for an orderly retirement of the total debts.
The estimates below make a cut off at 2040 and are for the wells started as from Jan-08 and per Jun-16.
Nominally to retire all debts (reach payout) would take an (average) future oil price close to $65/bo (WTI) for all the wells in operation as of end June – 16. This is without making any profit.
In the range of $85-90/bo (WTI) the Bakken (looking at it as one entity) would return about 7%.
The steep decline and a sustained low oil price ($45/bo) sets up a vicious dynamic which I will illustrate by using Jun-16 as a baseline.
For the wells in production as per Jun-16, the total extraction of these will decline about 40% by Jun-17, and depletes their remaining reserves with about 20%. By assuming the operations remain cash flow neutral, total debt remains at $36 B in Jun-17.
As from Jul-17 this would now require an average oil price of about $73/bo (WTI) for these wells to nominally retire all debts (reach payout). Additional wells will add to what price is required to retire the total debt.
To now reach a return of 7% takes an average future oil price of $110/bo (WTI).
This illustrates why a lasting, low oil price makes it harder to service and retire the debts assumed for LTO extraction.
The collapse in the oil price has made several companies address their debt problems [strengthen their balance sheets] through prepackaged Chapter 11 filings and equity/asset sales.
The Top 10 Wells by first 12 Months Totals in the Bakken (ND)
What follows is a closer look at the top 10 wells in the Bakken as of June-16. The wells were selected based on their first 12 months totals. These wells represent 0.1% of the wells in operation.
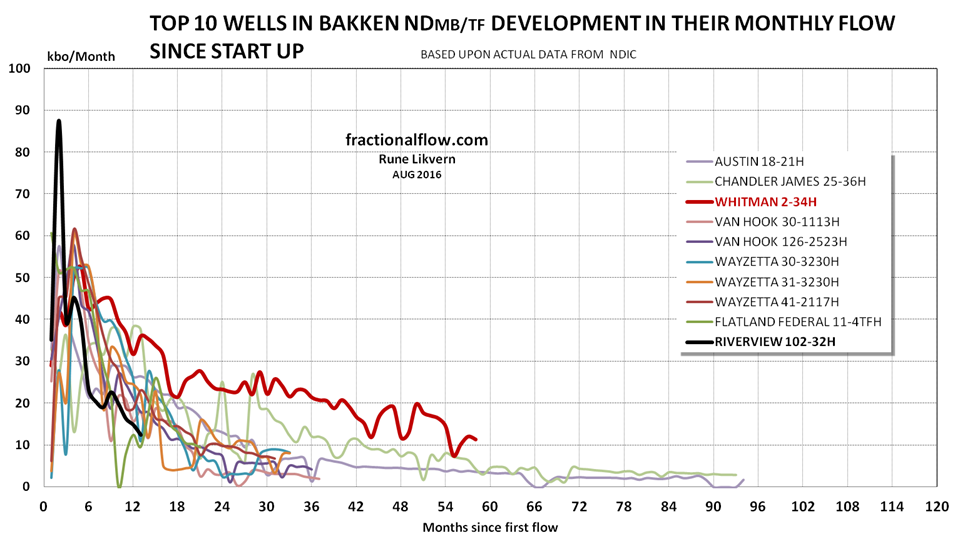

The chart above gives some idea about how the extraction rate for LTO wells slows over time and provides some guidance about the trajectories of the EUR for the wells. The most recent well, Riverview 102-32H, is after 13 months by totals number 10.

This well was on the confidential status until Nov-15, thus actual number of days in operation and the data on natural gas production was not disclosed by NDIC before Nov-15. Oil runs were used as a proxy for production for Jun-15 – Oct-15.
Note the rapid increase in the GOR (Gas Oil Ratio) since Feb-16, from about 3 to 4 while the LTO rate declined about 50%.

Would you agree that its becoming clear from your work and others (Jean Lahererre, Enno Peters, Tad Patzek etc.), reinforced by the observation that some of the big players are starting to sell up and leave, that this play is now in terminal decline, no matter what happens to the price, and ultimate recovery will be around 3 to 4 billion (oil and gas equivalent); and not even close to some of the higher values of 10 billion and more suggested by EIA and the North Dakota department of mines? It has got attention as it rose so quickly and was heavily hyped by the main proponents, but also because of the immediate and dramatic impact on the local economy, and partly, I think, because there has been good data available to allow third party analyses like this. I’d be more interested now in someone explaining why there is so much attention in the Permian (is there nothing better around) and what will be the near and medium term futures for exploration and development groups in conventional oil as discoveries dwindle off to nothing (long term they are finished, but the timing is interesting). The sort of financial story you tell above is going to be increasingly applicable across the board.
LikeLike
Hello and thanks!
In my opinion the spectacular growth in the Bakken was fueled by massive amounts of debt. Had the oil price remained at $100/bo, the Bakken as an entity would have become profitable.
The prospects now are that several companies will struggle to pay down their debt and/or recover their investments. A few companies with good wells will show some profits.
It becomes a challenging exercise to both service the huge debts and at the same time bring in enough wells that could reverse the decline. Few companies have not started to address their debt overhang in a meaningful way.
The sweet spots/pools (Grail, Parshall and others) are past their prime and is about to become saturated with wells.
The ultimate recovery (for the Bakken) is a function of both price and geology and so far about 3.5 billion (Gbo) has been developed by some 10,700 wells per Jun-16.
Observations from actual data so far suggest the late life declines of the wells are higher than modeled.
Much of the shale has been about investors looking for yield, which now may help explain the focus on Permian.
Some companies has deferred exploration in costly regions (the Arctic), cut further down on exploration and focused on acquisitions. That by itself illustrates the companies’ expectations.
LikeLike
As a conventional oil producer, I appreciate the work done here and elsewhere to sort out the facts from the “power points”. At an industry conference in 2013, I asked another PE friend how you could drill “100% IRR after 100% IRR well and only make a 13% ROA?”…. He said “you can’t”.
If you can track the math, calculating an IRR using time 0 for all of the investment versus ROA which spreads the investment over the productive life, and the benefit of booking say 50% of proven reserves as undeveloped to offset acreage costs without well costs, you will come to the conclusion that you can’t.
So, what good are 40% IRR wells? There is nothing left for the shareholder (equity owner) in that deal.
LikeLike