In this post I present actual Norwegian crude oil extraction and status on the development in discoveries and reserves and what this has now resulted in for expectations for future Norwegian crude oil extraction.
This post is also an update of an earlier post about Norwegian crude oil reserves and production per 2015.
Norwegian crude oil extraction peaked in 2001 at 3.12 Million barrels per day (Mb/d) and in 2016 it was 1.62 Mb/d, growing from 1.57 Mb/d in 2015 and 1,46 Mb/d in 2013 (a growth of 10% since 2013).
The Norwegian Petroleum Directorate’s (NPD) recent forecast expects crude oil extracted from the Norwegian Continental Shelf (NCS) to become 1.60 Mb/d in 2017.

Further, the chart shows a forecast for total crude oil extraction from sanctioned discoveries/fields (green area, refer also figure 02) and expected contribution from Johan Sverdrup phase I (blue area) [at end 2016 estimated at 1.78 Gb; [Gb, Giga (Billion) barrels, refer also figure 07] and this development phase is now scheduled to start flowing in late 2019.
My forecast for 2017 is 1.51 Mb/d with crude oil from the NCS.
My forecast shown in figure 01 includes all producing and sanctioned developments, but not contingent resources in the fields (business areas). The forecast is subject to revisions as the reserve base becomes revised (as discoveries pass the commercial hurdles) the tail is likely to fatten as from 2022/2023 mainly due to Johan Sverdrup phase II and Johan Castberg (Barents Sea).
My forecast includes about 7% reserve growth (300 Mb) for discoveries in the extraction phase, but does not include the effects from fields/discoveries being plugged and abandoned as these reach the end of their economic life.
Discoveries sanctioned for development and Johan Sverdrup (with an expected start up late 2019) is expected to generally slow down the decline in Norwegian crude oil extraction.
My forecast in figure 01 shows that the Norwegian crude oil extraction will be in a considerable decline until Johan Sverdrup Phase I builds towards the plateau. Norwegian oil consumption is now around 0.2 Mb/d, and with what is known about Norwegian crude oil reserves, Norway will remain a net exporter of crude oil for another 20 to 30 years.
Discoveries under development and scheduled to start to flow during 2017 – 2019
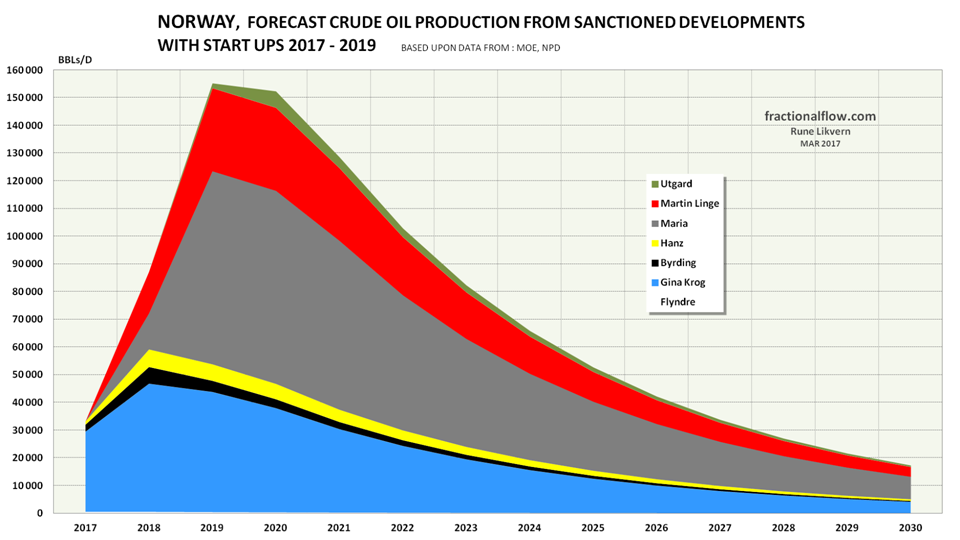
It is now expected that around 0.03 Mb/d (Mb; Million barrels) on an annual basis will be added during 2017 from start ups of sanctioned developments like Gina Krog, Flyndre, Hanz and Byrding.
Norway extracted, sold and delivered around 591 Mb of crude oil in 2016, up from 572 Mb in 2015 (up 3%).
The 4 sanctioned developments scheduled to start up in 2017 are now estimated to add around 130 Mb of crude oil reserves for extraction in 2017 (developments/discoveries reported under existing business areas and are not included) while expected extracted is 550 – 570 Mb.
My 2016 forecast
In the spring of 2016 I forecast that crude oil extraction from NCS in 2016 would become 1.50 Mb/d and it became 1.62 Mb/d. The reasons for this deviation are several.
My model used for forecasting Norwegian crude oil extraction for my 2016 forecast left out one discovery/field (a broken link) which, when adjusted for, would have brought my forecast to 1,55 Mb/d in 2016.
Fields that had been in the extraction phase before 2002 lost “only” 22 kb/d during 2016 (less than half of what was expected). New developments delivered 38 kb/d more than expected. This is due to combinations of less downtime and recent developments delivering (way) above expectations.
The flip side to developments delivering above expectations are that they later are likely to have steeper declines.
kb/d; kilo (1,000) barrels per day
A closer look at actual crude oil extraction

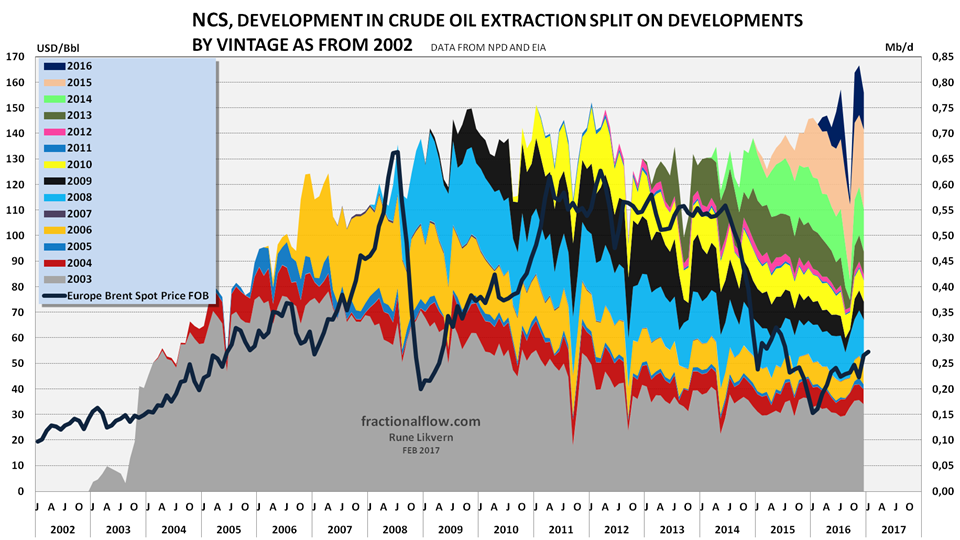
Note the recent years slow down and temporary reversal in crude oil extraction from discoveries starting to flow prior to 2002. Collectively these grew their extraction with 28 kb/d since 2013.
In 2016 around 54% of the crude oil came from business areas that started to flow prior to 2002 while 46% came from 49 (out of 76 with reported crude oil extraction) discoveries started since 2002.
The high oil price in recent years allowed for more infill drilling and developments of discoveries within existing business areas. Infill drilling allows both for accelerated depletion and increased recovery. Inasmuch infill drilling has been widely used in recent years, a period with lasting lower oil prices may materialize itself through higher decline rates.
The characteristics of “small” deep water discoveries/fields (here defined as having less than 100 Mb of recoverable crude oil) are a fast build up, followed by a short plateau (typically 2 years) succeeded by steep declines, typically at annual rates of 15 – 25%, refer also figures 09 and 10.
A growing portfolio of small discoveries with short plateaus followed by steep declines makes it increasingly difficult to keep pace with the “Red Queen”. The portfolio of developments sanctioned in the high price environment is fast being depleted.
Several of the recent NCS developments that were sanctioned after the increase in the oil price have after the price collapse been subject to considerable reserves (and thus financially) write downs which also weakens the companies’ balance sheets and affects their financial capacities for future investments. Several of these developments were sanctioned on the expectations of a lasting high oil price.
The bigger picture
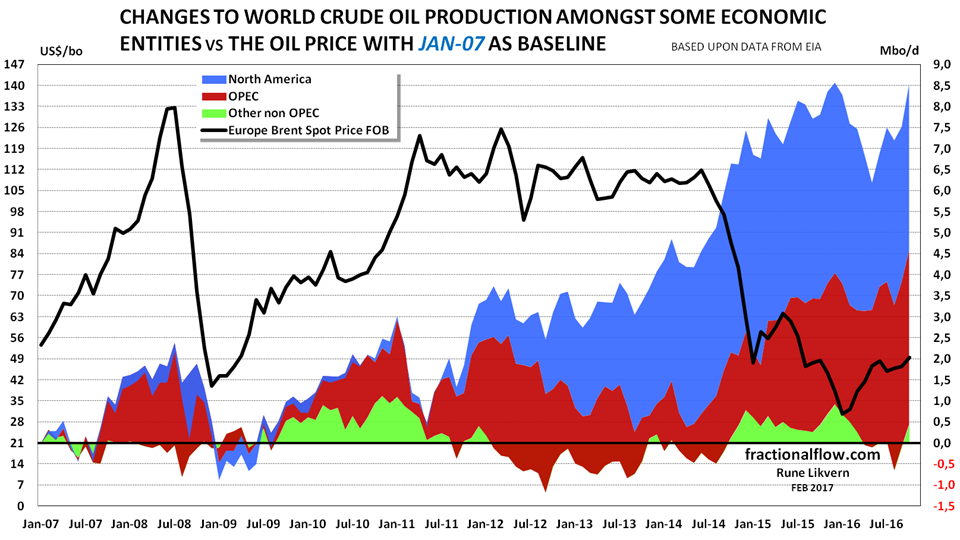
The chart also reveals another interesting fact, other non OPEC (light green area) had a negligible change to their oil extraction during the years the oil price remained high. The other non OPEC share of the global crude oil supplies has been in a steady decline since 2007 and was at about 37% (about 30 Mb/d) in 2016.
Increased supplies of expensive to develop oil from other non OPEC came on stream (due to the time lag from sanction to flow) just in time to give its contribution to collapse the oil price and weaken its price support.
The development in other non OPEC crude oil supplies while oil prices remained high is a giveaway about their future potential for crude oil supplies.
The R/P ratio reveals the future trajectory for NCS crude oil extraction
A simplistic description of the R/P ratio (Reserves at year end divided by the Production for that same year) is the (theoretical) number of years the extraction/production level may be sustained using that year as a baseline. In the real world it works somewhat differently, as the reservoir depletes the extraction will (normally) decline. This may result that the R/P ratio remains fairly constant during the decline/tail phase as the reservoir depletes and the extraction declines.
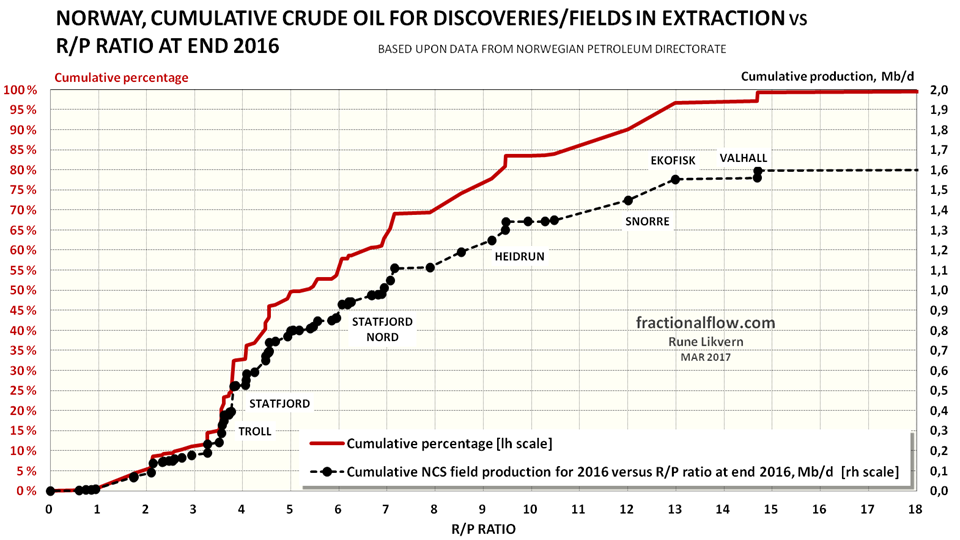
Figure 06 illustrates that about 50% of the NCS crude oil extraction in 2016 was from 42 fields/discoveries (out of 76 with reported crude oil extraction) with an R/P ratio of 5 or less.
Broadly speaking reservoirs of crude oil with an R/P ratio of less than 5 should be expected to exhibit steep depletion induced declines in extraction, and year over year declines in the range of 15 – 25% has been observed.
Development of Norwegian crude oil reserves
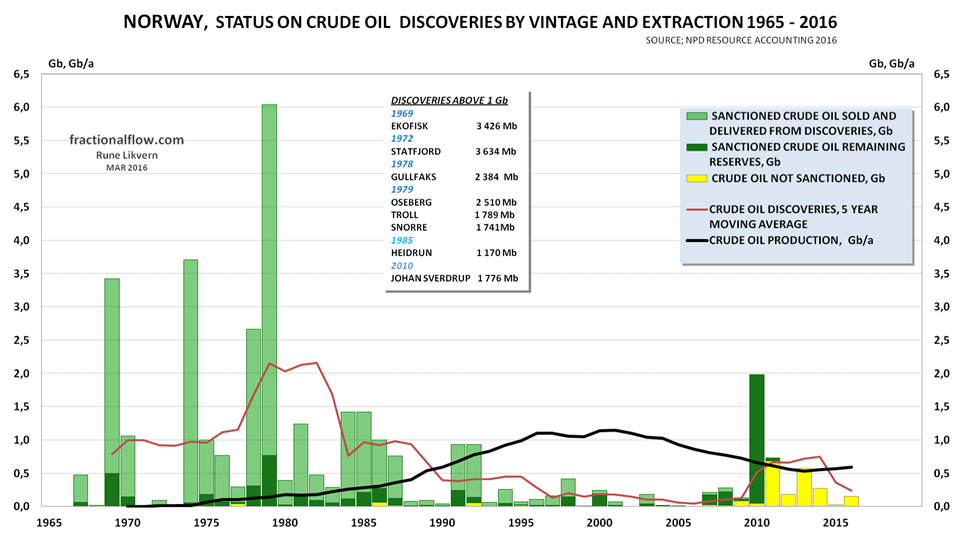
(Gb; G = Giga, Billion barrels)
Figure 07 illustrates that the biggest NCS discoveries were made early and these discoveries continues to contribute a big portion of total NCS crude oil production.
Of 18 discoveries started from 2012 to 2016 NPD data shows a downward revision to total estimated recoverable reserves from 1 034 Mb to 967 Mb or about 6%.
Discoveries and contingent reserves in fields now hold the potential to add about 4 Gb to a total of about 36 – 38 Gb of reserves.
Figure 07 also illustrates that the growth in the oil price above $50/b in 2005 allowed for increased exploration activities resulting in several successful discoveries with the most prominent being the Johan Sverdrup discovery in 2010.
The chart above is based upon Norwegian Petroleum Facts.
(A site operated by the Ministry of Petroleum and Energy [MOE] and the Norwegian Petroleum Directorate [NPD].)

The light green portion of the columns shows the development in total extracted, sold and delivered. The dark green portion shows the development in estimated remaining recoverable reserves. The yellow portion shows the development in total estimated reserves in discoveries that are under evaluation and that has not been sanctioned at end 2016.
Depletion and decline rates for small deep water discoveries
A closer look at deep water fields illustrate the rapid depletion and high decline rates, which are typical for discoveries/fields with about 100 Mb of recoverable crude oil.
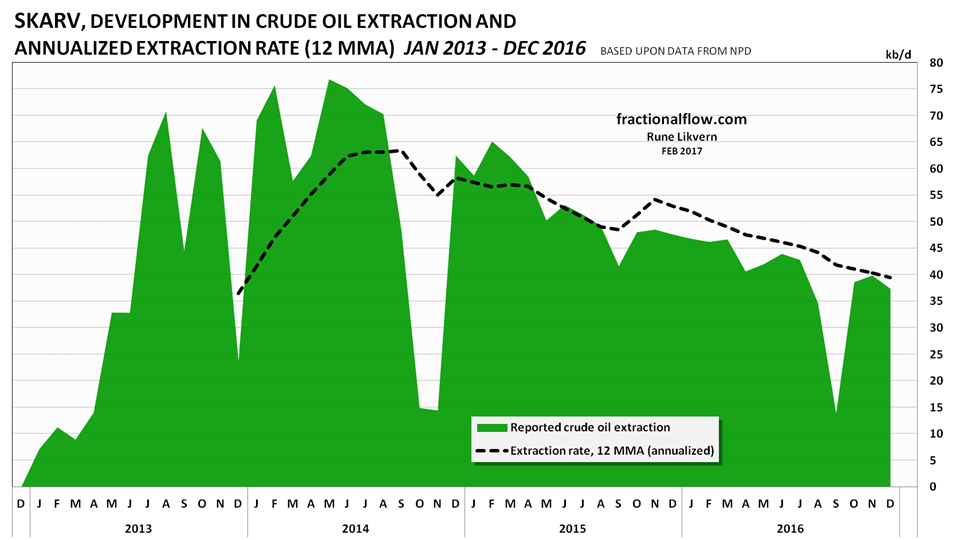
At end 2016 NPD estimated Skarv to contain 120 Mb with original recoverable crude oil.
Skarv had an annualized decline of about 25% in 2016.

At end 2016 NPD estimated Skarv to contain 120 Mb with original recoverable crude oil.
The past high crude oil depletion rate for Skarv and its R/P of 3,6 at end 2016 suggests now a continued high decline rate in the extraction.

“My forecast […] does not include the effects from fields/discoveries being plugged and abandoned as these reach the end of their economic life.”
Do you know how many fields that are likely to be plugged in the next five years and do you know how this change the downslope compared to your forecast?
“The high oil price in recent years allowed for more infill drilling and developments of discoveries within existing business areas. Infill drilling allows both for accelerated depletion and increased recovery. Inasmuch infill drilling has been widely used in recent years, a period with lasting lower oil prices may materialize itself through higher decline rates.”
This is a big one and not just for Norway. If producers picked a lot of low hanging “infill drilling” fruit in 2010-2014 then decline rates are likely to accelerate in many regions.
LikeLike
“Do you know how many fields that are likely to be plugged in the next five years and do you know how this change the downslope compared to your forecast?”
In 2016 4 fields representing 9 – 10 kbo/d on an annual basis in 2016 was shut in and is to be P&Aed.
For the years 2017 – 2019, 7 fields are now reported planned shut in and P&Aed and these represented 13 – 14 kbo/d in 2016.
Sorting by R/P ratios and flows for 2016 an additional 5 fields were found to be likely candidates for shut in and P&A during the next 3-5 years. These contributed about 5 kbo/d in 2016.
The oil price will be one of the important parameters that determine remaining economic life for fields in late extraction phase.
About 2% of the Norwegian crude oil extraction is now very likely to get shut in due to economics during 2016 – 2020.
The article linked below (in Norwegian) has some more about this subject.
http://www.aftenposten.no/okonomi/Det-vil-koste-5_7-milliarder-a-stenge-dette-oljefeltet-604705b.html
Under equal circumstances this would result in a steeper downslope, but given that some fields delivers more and some less than expectations, this may also come within the error margins for the forecast.
“This is a big one and not just for Norway. If producers picked a lot of low hanging “infill drilling” fruit in 2010-2014 then decline rates are likely to accelerate in many regions.”
Agreed.
This item also includes developments of smaller discoveries within existing business areas which are drained like other small offshore discoveries.
LikeLike