This post presents a closer examination of actual data on Light Tight Oil (LTO) extraction, developments in water cut and Gas Oil Ratio (GOR) for some pools and individual wells in the Middle Bakken and Three Forks formations in North Dakota.
LTO extraction’s primary drive mechanism is (differential) pressure and there are some noticeable trends for LTO extraction from Bakken:
- LTO productivity (measured as average totals by vintage) in 2014 have increased, most notably from the Middle Bakken formation which has better well productivity than Three Forks.
There are differences to LTO productivity developments amongst the pools. - Water cut; generally increases as the wells ages.
An indicator for depletion. - Water cut; generally increases for newer wells.
This suggests that the areas with the highest oil saturation has been developed. - Gas Oil Ratio (GOR, produced and expressed as Mcf/Bbl); generally increases as the well ages.
- What appears to characterize a Bakken sweet spot is the presence of natural fractures (favorable geology), high oil saturation and a pressure above hydrostatic pressure.
Further, this post also has a brief look into well economics and describes how well manufacturing is likely to be affected by the decline in the oil price and what this may entail if a lower oil price ($70/Bbl, WTI) is sustained.
![Figure 01: The chart above shows development in the water cut [water cut = [water/(water + LTO)] for the “average” wells by vintage in North Dakota. Produced water (brine) is transported to dedicated disposal sites. Chart by Enno Peters.](https://runelikvern.com/wp-content/uploads/2020/05/bdc79-figure-01-water-cut-by-vintage-by-enno-peters.png)
Chart by Enno Peters.
This post contains in total 30 charts that hopefully are self explanatory.
Acknowledgements
This post was made possible by contributions, comments and suggestions from several professionals within the oil industry and the academia.
The invaluable talents and expertise of Enno Peters made it possible to transform the NDIC monthly production data with the formation data into spreadsheet format.
The spreadsheet format allows to sort well data by formation, pool, vintage, company and much more.
NOTE: Actual data used for this analysis are all from North Dakota Industrial Commission (NDIC). Some data are missing for some wells and after discussions, the consensus was that the presented average LTO numbers after the first 12 months should have around 5% added to account for missing data from some wells as well as adjusting for the effects from assuming all wells starts at day one of its reported first month of operation (on average each well flows for half a month during its first month of reported operation).
For wells on confidential list, data on runs was used as a proxy for production.
By adding around 5% of the presented average flows for the first 12 months and around 4% after 36 months numbers should come close to actual.
Production data for Bakken, North Dakota: Monthly Production Report Index
Formation data from: Bakken Horizontal Wells By Producing Zone
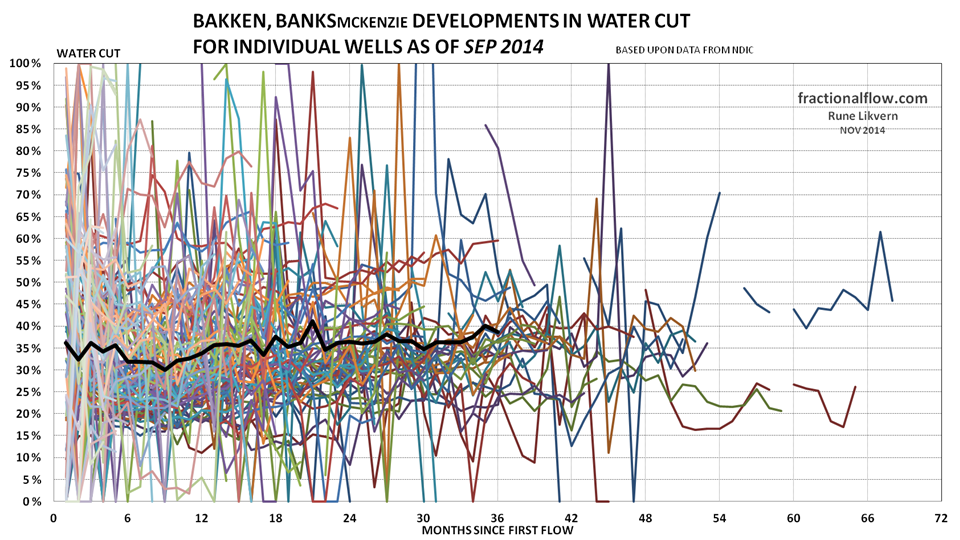
Water cut is the ratio of [produced water/(produced water + produced oil)] and expressed as a percentage.
Water cuts for individual wells may swing from 0% to 100%, suggesting a shut in well or data not reported. For the early months of a well’s life the water cut may be influenced from water used for fracking.
The important messages from this analysis are the trends in well productivity, water cut and GOR on an aggregate level and by vintage.
For this presentation wells from two pools in Mountrail (Alger and Van Hook), McKenzie (Banks, Camp) and Williams (Squires, Todd) are presented. Hopefully these pools constitutes a good representation of developments for similar pools.
A growing portion of wells have been/are being targeted the Three Forks formation which may suggest something about remaining attractive targets to drill in the Middle Bakken.
Growth in the Water Cut
It was identified two main causes for the growth in water cut;
- The growth in water cut for newer wells was found to be due to a growing number of wells drilled into formations with lower oil saturation (or higher water saturation).
- The growth in water cut as the wells ages is very likely associated with pressure depletion.
A growing water cut will increase the specific operational costs ($/Bbl) as produced water (brine) needs to be disposed of at dedicated sites that pumps it into a suitable formation.
Gas to Oil Ratio (GOR)
On average Bakken wells has a production Gas to Oil Ratio (GOR) of 1.1 – 1.2 Mcf/Bbl, and this shows considerable variation between pools and individual wells within the same pool. Monitoring the developments in GOR is one paramount task for formation/reservoir/well management.
As (differential) pressure (pressure depletion) is the primary drive mechanism for LTO extraction, a gradual lowering of the down hole well pressure lowers the oil’s ability to hold gas and thus some additional (free) gas gets produced with the oil.
In the shale formation gas is dissolved in the oil and one of the objectives of pressure management of the formation/well is to control the depleting formation pressure relative to the bubble point of the oil. If the pressure in the shale formation falls below the bubble point these risks the formation of unwanted free gas, which affects the flows of liquids (LTO and water).
Normally the lower the bubble point pressure is, the lower the GOR becomes as oil loses its ability to hold dissolved gas.
A general observation from observing the developments for a few Bakken LTO wells showed that when the (produced) GOR suddenly increased the LTO and produced water extraction rapidly fell below trend, refer also figures 09 and 21.
Mountrail

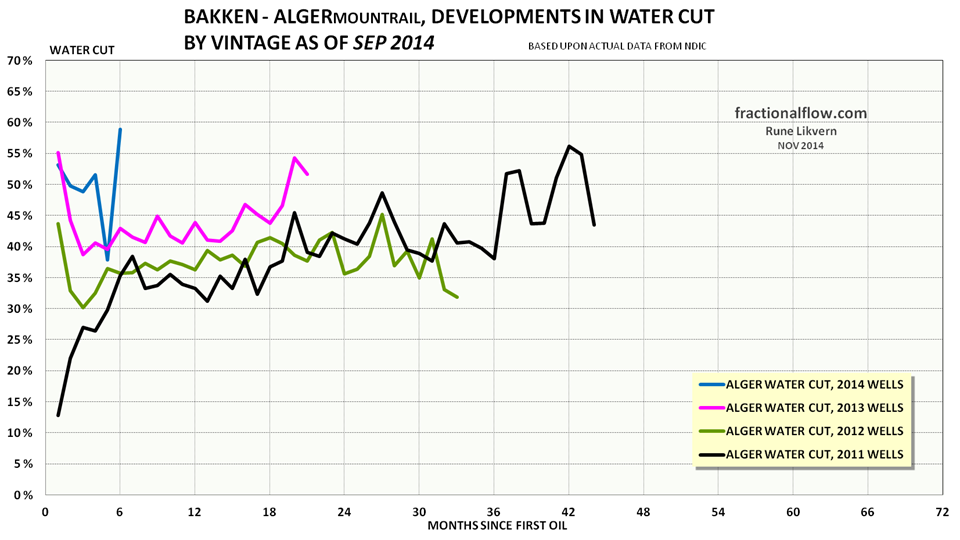
For Alger well productivity has declined with time and 2014 is too early to make a final call on.

Note for 2014 the selection were limited to wells with at least 6 months of flow.

Note for 2014 the selection were limited to wells with at least 6 months of flow.
In general the productivity of the Three Forks formation in Alger is somewhat poorer than the Middle Bakken formation. For the Van Hook pool the productivity (first 12 months totals) appears to be the same, ref also figure 12.

Water cut of 0% for some wells suggests these were shut in or produced water not reported on the forms where the data was pulled from. The first months flow of produced water may be influenced from water used for fracking the wells.
Note for 2014 the selection were limited to wells with at least 6 months of flow.


Note for 2014 the selection were limited to wells with at least 6 months of flow.
![Figure 09: The chart above shows developments in LTO extraction, produced water [lh scale] and Gas Oil Ratio (GOR) [rh scale] for one well in the Alger pool in the Middle Bakken formation.](https://runelikvern.com/wp-content/uploads/2020/05/8b45e-figure-09-alger-well-lto-water-and-gor.png)

Developments in total LTO extraction from wells in the Van Hook appear to be all over the chart. Note also that wells in Van Hook are generally better than in Alger shown in figure 02.

Note for 2014 the selection were limited to wells with at least 6 months of flow.
Well productivity for Van Hook has in general improved in recent years.

Note for 2014 the selection were limited to wells with at least 6 months of flow.


For Van Hook the increase in water cut by vintage is considerable.
McKenzie
A general feature of the presented wells for pools in McKenzie and Williams counties is that those with time shows less spread in total LTO.


Note for 2014 the selection were limited to wells with at least 6 months of flow.


The initial GOR appear to be fairly constant by vintage and increases at the same rate as the wells age. The same was observed in the Alger pool, refer also figure 08, and Alger had a lower GOR than Banks.
![Figure 21: The chart above shows developments in LTO extraction, produced water [lh scale] and Gas Oil Ratio (GOR) [rh scale] for one well in the Banks pool in the Middle Bakken formation.](https://runelikvern.com/wp-content/uploads/2020/05/924dd-figure-21-banks-well-lto-water-and-gor.png)


Williams


Production Management
Given the wide range of individual characteristics of pools and individual wells within the same pools, production management appears to be a very demanding task as this involves dealing with a portfolio of wells with individual characteristics and thus bear much resemblance to herding cats.
A little on Light Tight Oil Economics
An alternative approach to break even price is to reverse the equation and solve it for estimates of break even flows (first 12 months totals) against various oil prices.
At a lower oil price a higher flow (well productivity, here defined as first 12 months totals) is needed to break even (meet expected return requirements) and vice versa for a higher oil price.
A LTO well recovers around an estimated 30% of its Estimated Ultimate Revoverable (EUR) during its first 12 months of flow. This makes the well economics sensitive to the price during the wells’ early life.
The break even oil price is for the estimated lifetime of the well. A lower price than the estimated break even reduces the return (profitability) and vice versa.
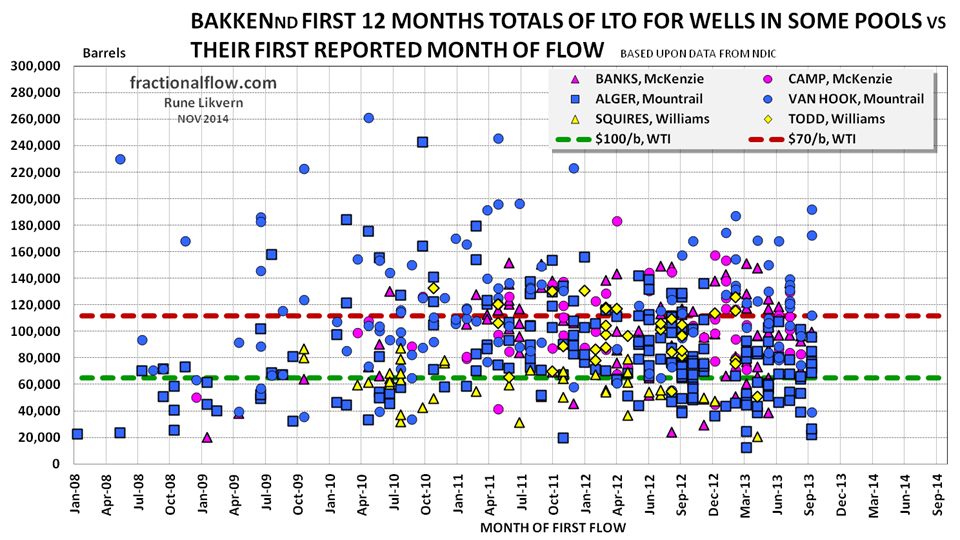
The red dotted line shows estimated first 12 months break even flow with an oil price of $70/Bbl (WTI), the green dotted line at $100/Bbl (WTI). Well data as of September 2014.
Assumptions to break even flow as described in figure 30 and with a 7% discount rate. Estimates are on a point forward basis (half cycle) and does not include costs for acreage acquisition, exploration etc.

The red dotted line shows estimated first 12 months break even flow with an oil price of $70/Bbl (WTI), the green dotted line at $100/Bbl (WTI). Well data as of September 2014.
Assumptions to break even flow as described in figure 30 and with a 7% discount rate. Estimates are on a point forward basis (half cycle) and does NOT include costs for acreage acquisition, exploration etc.

NOTE: Presented estimates are on a point forward basis (each well looked at as a freestanding project) thus estimates does NOT include costs for acreage acquisition, exploration etc.
The higher the requirement for return, the higher the breakeven price or breakeven volume becomes.
Cash Flow Positive
The LTO wells will flow as long they are cash flow positive, estimated at an oil price above $10 – $12/Bbl at the wellhead (or roughly $25 WTI).
This should not be confused with what price the wells require to break even, that is; earn a return on their investment.
What a lower Oil Price may lead to
If oil prices remain low ($70/Bbl WTI) I would expect the oil companies to target those areas that have profitable potential at this price level. This will with time, reduce the scale of well manufacturing, but also result in an increase average well productivity.
A sustained lower oil price brings also with it the prospects of lower costs for well manufacturing in the shales as suppliers reduce their prices.
A sustained lower oil price and higher interest rates may bring deleveraging forward in time, that is companies with a heavy debt load will bring this down by using a portion of their lower cash flow. This will affect the company’s capital expenditures for well manufacturing.
According to the Directors Cut for November 2014 there were more than 600 wells awaiting completion in Bakken North Dakota and it takes money to complete these wells and bring them into production.
What remains to be seen is how a sustained lower oil price will affect developments in total LTO extraction from Bakken.

Rune,
Citi seem to be of the opinion that robust growth can be sustained in shale output with a lower price, since the low quality wells which won’t be drilled will in general contribute less to overall production than the ones which will continue to be drilled. Do you think this is likely?
If the drillers do end up going this route I imagine it would result in sweet spots getting drilled out even more quickly, thus making the eventual peak and decline that much faster.
The rapid response of shale production to changes in oil price is really what worries me. In systems dynamics increasing how quickly you react to information feedbacks can serve to increase volatility in the system, as overshoots and undershoots get ever larger. I think we are starting to see this manifest itself now
LikeLike
Going forward I think funding (the oil price) for LTO well manufacturing will become the overriding issue. At present oil price $60/b (WTI) few drilling targets will make financial sense (point forward/half cycle basis).
The most recent Directors Cut (Dec 14) said that 650 wells were awaiting completion (in Bakken ND) and for me completion is installation of production tubing and downhole equipment which normally requires a rig. Completion and fracking are roughly 70% of the costs of an operational LTO well and it requires money.
I have been puzzled by the high (and growing) number of wells drilled and awaiting completion. That there would be some backlog (inventory) of wells drilled and awaiting completion should be expected, but 650?
That does not make financial sense unless the operators know something about the productive potential for these wells.
What the presented study (this post) shows are with time there is a gradual increase in water cut. This suggests (to me and others) that more recent wells in general are being drilled into rock formations with lower oil saturation.
Focusing more intensely on the good targets will IMO set up the dynamics you describe.
With regard to Citi’s expectations I do not know what that is based upon.
What I would expect with a sustained lower oil price is that the number of producing LTO wells added will come down (and theses wells productivity on average may likely improve) and these will offset some of the decline from the growing number of vintage wells.
Winter weather has normally slowed activities. Fracking gets more challenging with temperatures below freezing as it requires a certain temperature of the water to get it to gel properly.
I do not agree with Citi’s assessments that LTO production will grow with a sustained lower oil price ($60/b WTI).
But what do I know, I base my analysis by studying (and presenting) trends on actual production data for all the wells.
In a few months time we will know.
LikeLike
Dear Rune,
thank you for another interesting post. I am irritated by the development of Natural Gas production. Drilling peaked in 2011, drilling rigs were redirected to oil and to this day there is no reduction in output. So shale wells are maybe more resilient than previously thought. If that is the case then shale oil output will also not decline but plateau. What do you think?
LikeLike
Hi and thanks!
I prefer to make my judgement from actual data. So far, newer wells (2013 and 2014 vintage) flows more LTO in the few first months of their life, but (and as of now) they age the total flow converges with the older wells.
In other words the decline rate is steeper for younger wells.
The high number of producing wells added has offset the decline from the older wells and grown total LTO extraction.
LikeLike
Thank you Rune, I guess the same applies for Natural Gas wells. Also, as I learned on another site (energymatters.com), LTO has a high proportion of NGLs and Gas. So I will have to wait until the total # of drilling rigs utilized goes down or fewer drilling locations become available.
LikeLike