This post is an update on total Light Tight Oil (LTO) extraction from Bakken in North Dakota based upon actual data as of October 2014 from North Dakota Industrial Commission (NDIC). It further presents a statistical analysis on developments of well productivity with a detailed look at developments in Parshall, Reunion Bay and Sanish.
- There were general improvements in LTO well productivity in Bakken during 2013.
- Present trends in LTO well productivity for Mountrail’s sweet spots (Alger, Parshall, Reunion Bay, Sanish and Van Hook) suggests these are past their prime.
- Figure 29 in this post show development in well productivity for Alger and Van Hook and figures 06, 08 and 10 for Parshall, Reunion Bay and Sanish. A common feature for Parshall, Reunion Bay, Sanish, and Van Hook is that these reached new highs in well productivity for wells started in 2013.
Alger has been in general decline since 2011. - LTO extraction in recent years may be viewed as a source for global swing production for oil.
![Figure 01: The chart above shows development in Light Tight Oil (LTO) extraction from January 2009 and as of October 2014 in Bakken North Dakota [green area, right hand scale]. The top black line is the price of Western Texas Intermediate (WTI), red middle line the Bakken LTO price (sweet) as published by the Director for NDIC and bottom orange line the spread between WTI and Bakken LTO wellhead all left hand scale.](https://runelikvern.com/wp-content/uploads/2020/05/2a4e0-figure-01-bakken-nd-lto-oct-14.png)
NOTE: Actual data used for this analysis are all from North Dakota Industrial Commission (NDIC). Data are incomplete for around 2% of the wells.
For wells on confidential list, data on runs were used as proxies for extraction.
Production data for Bakken, North Dakota: Monthly Production Report Index
Formation data from: Bakken Horizontal Wells By Producing Zone
The important messages from this analysis are the trends in well productivity.
This post is an update and expansion of my post “Will the Bakken “Red Queen” Have to Run Faster?” from the summer of 2013 and may be read as a continuation of my post “Will the Bakken Red Queen Outrun Growth in Water Cut?”.
![Figure 03: The chart above shows developments by vintage in LTO extraction from the Middle Bakken and Three Forks formations in Bakken (ND) as of January 2008 and of October 2014 [right hand scale]. Development in the oil price (WTI) black line is shown versus the left hand scale.](https://runelikvern.com/wp-content/uploads/2020/05/b5fdc-figure-03-bakken-by-vintage-2008-to-2014-and-wti.png)
Development in the oil price (WTI) black line is shown versus the left hand scale.
What is the month over month legacy decline in total LTO extraction?
The month over month total decline for LTO extraction wobbles around due to seasonal effects, differences in productivity of the wells started in any month, variations to when in the calendar month the wells were started and number of days of the month.
Measurements from actual data showed that the smoothed month over month legacy decline varied between 5 – 6%.
From figure 03 it may be observed that the legacy decline rate slows with time.
How many net producing wells needs to be added to sustain the LTO extraction level from October 2014?
In October 2014 total LTO extraction from the Middle Bakken and Three Forks formations in North Dakota was 1.12 Mb/d.
The “average” well, so far in 2014, had a first month flow of 486 b/d.
This works out to a need of net monthly additions of 115 – 135 producing wells to sustain the October 2014 extraction level.
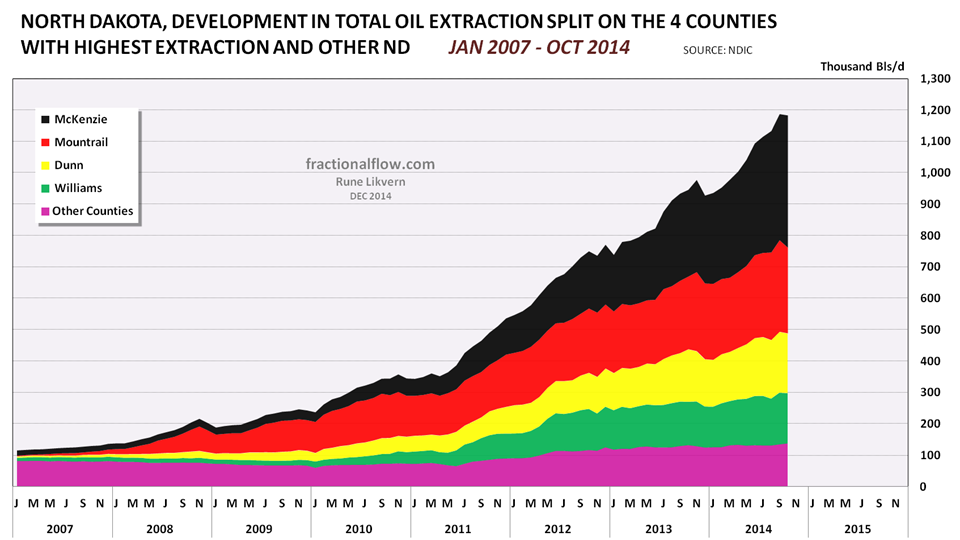
Mountrail
LTO extraction from Bakken in North Dakota really took off in Mountrail, which as of Janaury 2010 had around 60% of total LTO extraction.
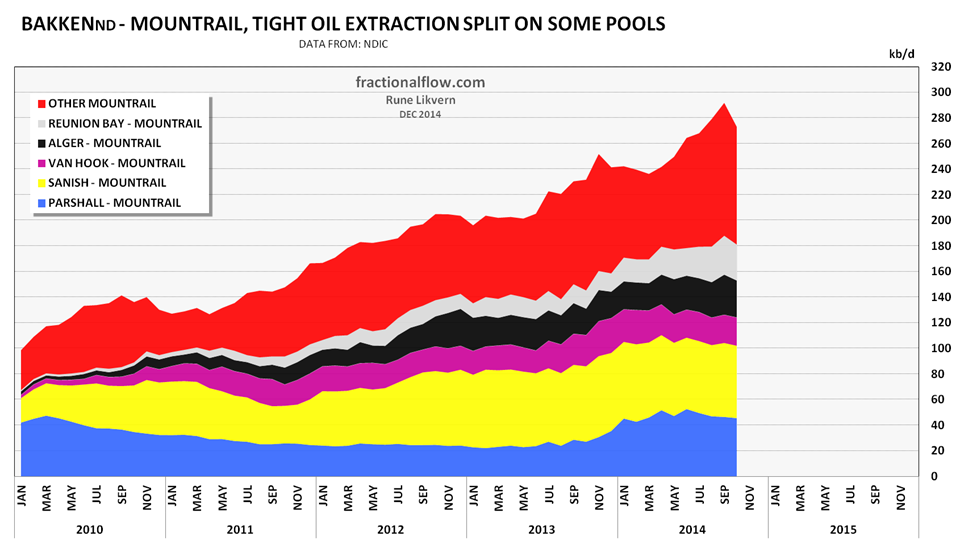
NOTE: The total LTO extraction includes extraction from wells on confidential list. The extraction from the shown pools does not include extraction from wells on confidential list, thus actual extraction from these pools should be expected to be somewhat higher than shown in the chart
Extraction from other Mountrail should thus be expected to be corresponding lower.
In Mountrail the growth in LTO extraction in the second half of 2013 coincided with the improvements in well productivities re also figures 06, 08 and 10.

The data show that the best wells came early, those started in 2008. Then follows 2013 (refer also figures 06, 08 and 10).
So far “average” 2014 wells in Mountrail have been poorer than those started in 2013.
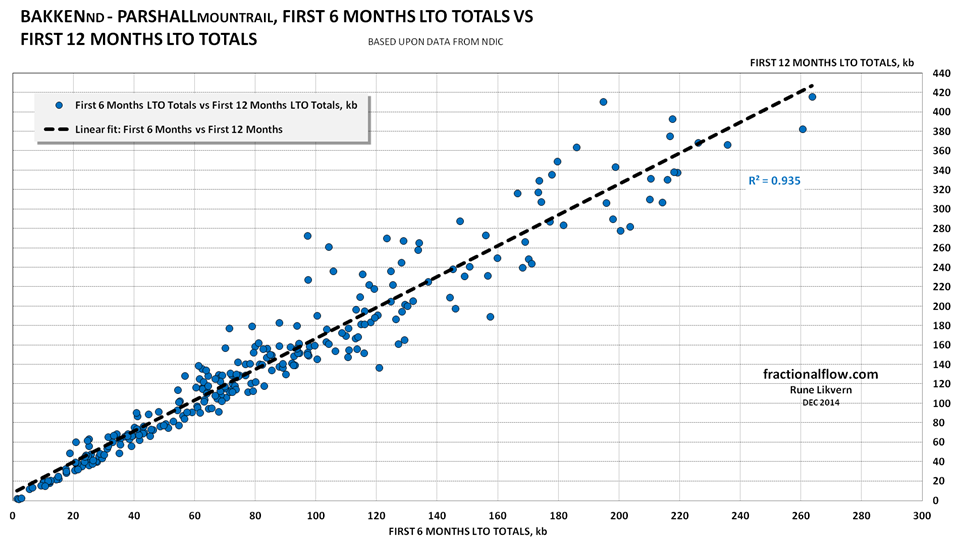
Parshall
The wells in Parshall are very good LTO producers.

Parshall covers an estimated area of 300 square miles (1 square mile = 640 acres) and had 340 reported flowing wells as of October 2014.
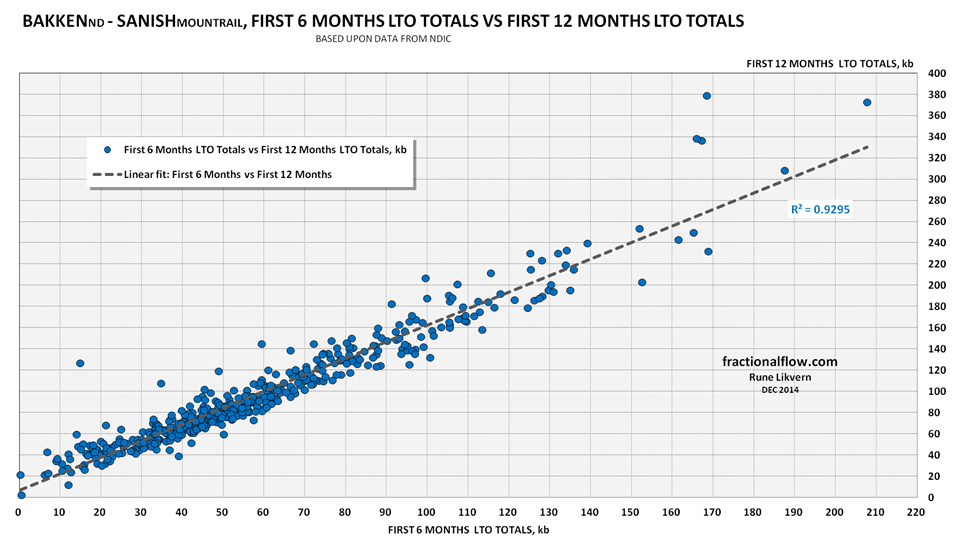
Sanish

So far it appears the best wells in Sanish was brought to flow during the first half of 2010. In Sanish wells with less than 6 months reported flow have totals close to those with more than 6 months flow started in 2014. The well productivity appears to have flattened.
Reunion Bay
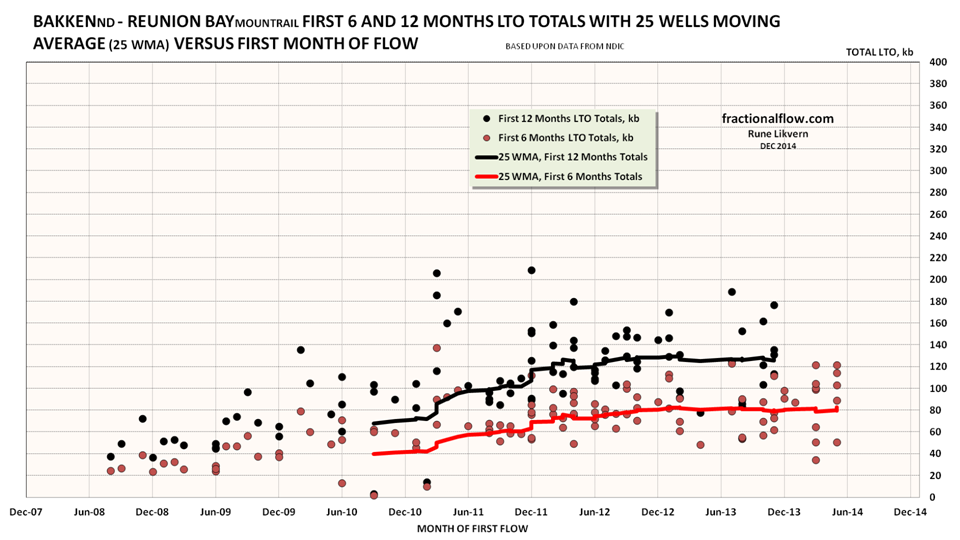
For Reunion Bay there was a gradual improvement in well productivity starting in the second half of 2010. As of recently this productivity has remained fairly stable.
The Analysis/Study
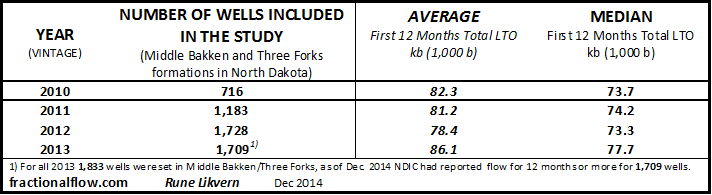
The correlation analysis includes around 3,600 wells started in 2010, 2011 and 2012.
Distribution of LTO Wells by Vintage
Initial Production (IP), 30, 60 days flows is short term and early indicators that give away some information about a well’s productive potential, but shows poor correlations with long term well productivity developments.
The focus on short term performances should be considered with some reservations.
Our societies depend on long term predictable flows of oil and its affordability. Short term fluctuations may obscure worrisome underlying trends that easily become drowned out by noise, thus obscuring THE SIGNAL.

How to read the chart: The lines show the normal distribution for all studied wells started in 2010, 2011, 2012 and 2013. It shows that 30% of all the wells had a first 12 months total flow of 60 kb or less. Alternatively 70% of the wells had a first 12 months total flow of 60 kb or more. About 15% of the wells had a first 12 months flow of 125 kb or more.
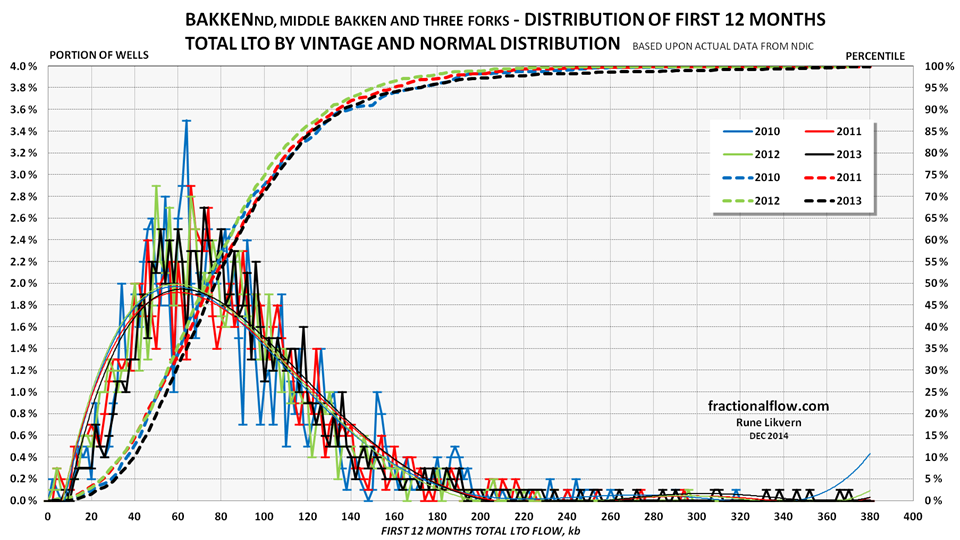
The chart also shows the normal distribution (plotted towards the right hand scale) of the first 12 months total flow for the LTO wells from Bakken (ND) for 2010, 2011, 2012 and 2013 subjected to the time series analysis. The colored dotted lines show the normal distribution by vintage of all the studied wells.
The thin lines are polynomial fits of 5th order of the distributions (left hand scale).
The distribution of wells productivity begs the question about how much this is influenced by the oil price, well design and geology. Improvements in well design have so far resulted in improvements in well productivity, but as demonstrated in this post water cut has increased, suggesting more recent LTO extraction comes from formations with lower oil saturation.
Correlation analysis, how the length of the time series improves accuracy
The correlation analysis includes around 3,600 wells started in 2010, 2011 and 2012 and that had 24 months or more of reported flow.
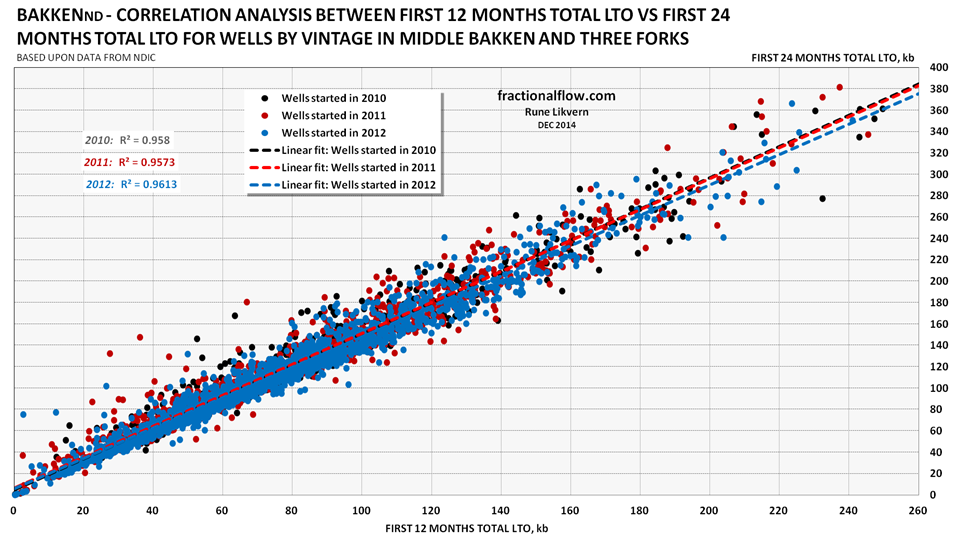
The linear fits show that wells started in 2012 were poorer than in previous years.
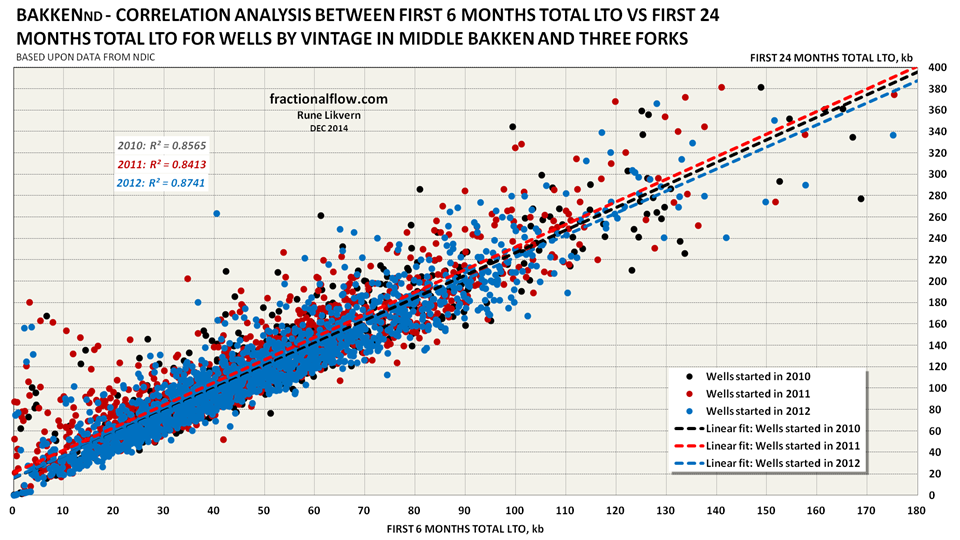
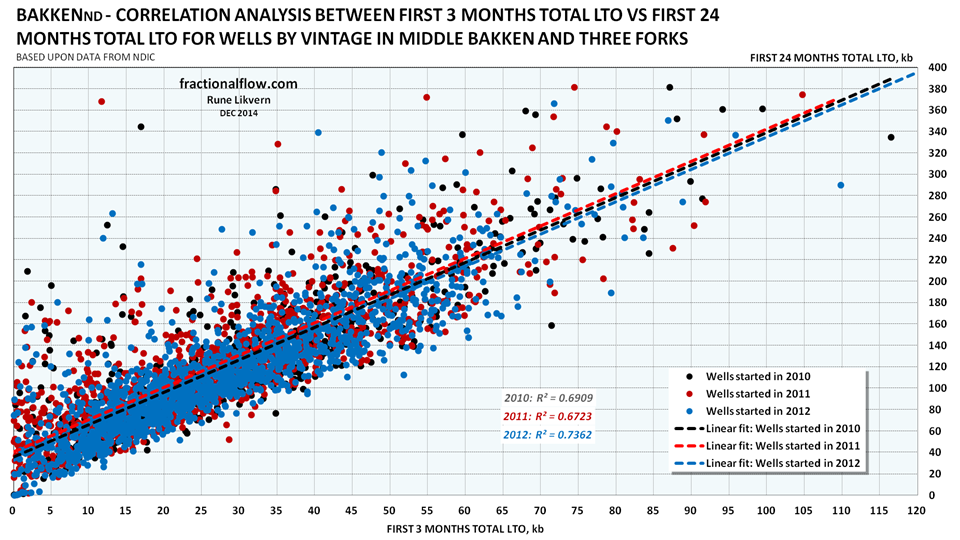
Figures 13, 14 and 15 shows that correlation improves with the length of the LTO extraction time series thus improving the predictability of the wells’ productivities.

Dear Rune Likvern,
I very often follow discussions on peak oil items and in my opinion I think that something is quite slowly by steadily going terribly wrong. How much oil is left and is it easy to get out of the ground … a lot of confusion.
I would be very glad if you would consider the following theory:
In most part of mankind’s existence we were totally dependent on the fruits of Nature which I consider to be an Energy System which keeps us all alive . With the evolution of Agriculture this did not change very much. But there was a very important difference: We could accumulate food and other products from Agriculture which I consider to be an Energy System derived from Nature – I would call this ‘secondary’ energy system Energy System Agriculture. The start of Agriculture – I think – was a long journey with error and trials and ups and downs. However, as time passed Agriculture gave us a broad variety of many different goods. And now not all people had to toil in the fields. Some people were (partly) released to do other things – to specialize. But one thing was certain: They were all totally dependent on what Agriculture gave them. Wheat, cotton, meat – you mention it – all originated from Energy System Nature + Agriculture. I imagine that in the very beginning of Agriculture those people thus released from working in the fields were paid with the products of Agriculture and barter was the predominant way of exchanging goods and work – I must underline that payment must have been in form of goods from Nature and especially Agriculture. And this form of payment persisted in thousands of years (taxes and tithe) but gradually the supply og different articles got so immense that you had to ‘invent’ a measure of different products. This invention/development/evolution was money. In that time people would know that you could for instance exchange 20 kg of wheat for one goat or 2 kg of cotton + 6 kg of rice for a week’s work digging a new well (or something like that). Therefore money must have represented a measure of the energy of that time as all goods came from the Energy Systems Agriculture + Nature. The use of fossils (in machines) did not change that: The machines could produce articles in much bigger quantities but still – every article came out with a price tag on it that was nothing else than a measure of the activated energy in Energy System Fossils. With your salary you could buy articles but all articles had their origin in energy systems: Energy System Nature + Agriculture + Fossils.
Money is nothing but at measure of energy! The world production of oil goes up (and it apparently does) but still it seems that there is an energy problem. I see it in the following manner: If you have to spend more money to get the oil out of the ground then read it as follows: You have to spend more energy to get the oil out of the ground. That extra money/energy must be taken from the world community and the effect is in fact less energy although the production is rising. We therefore have to distinguish between net energy production and gross energy production where the net energy of course is what really matters. With less net energy at our disposal the world energy will shrink – in the last approximately 150 years the net energy at our disposal grew (and you could borrow money being sure that the net energy, i.e. amount of money, would expand in future (inflation) – but now it is all different – net energy shrinks and so does the amount of money at your disposal (deflation).
Best regards
Niels Colding
LikeLike