In this post I present actual Norwegian crude oil extraction and status on the development in discoveries and reserves and what this has now resulted in for expectations for future Norwegian crude oil extraction.
This post is also an update of an earlier post about Norwegian crude oil reserves and production per 2014.
Norwegian crude oil extraction peaked in 2001 at 3.12 Million barrels per day (Mb/d) and in 2015 it was 1.57 Mb/d, growing from 1.51 Mb/d in 2014.
The Norwegian Petroleum Directorate’s (NPD) recent forecast expects crude oil extraction from the Norwegian Continental Shelf (NCS) will decline to 1.53 Mb/d in 2016.
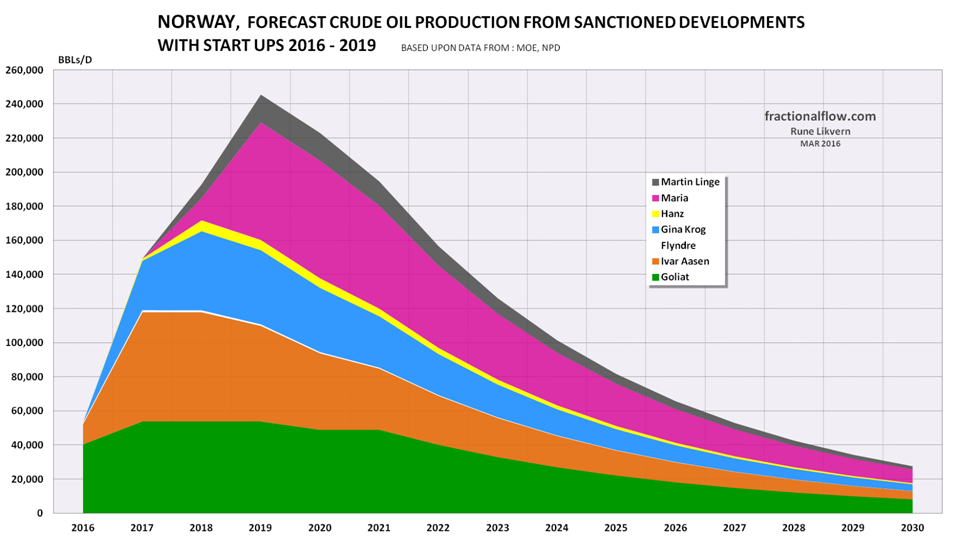
![Figure 01: The chart shows the historical extraction (production) of crude oil (by discovery/field) for the Norwegian Continental Shelf (NCS) with data from the Norwegian Petroleum Directorate (NPD) for the years 1970 - 2015. The chart also includes my forecast for crude oil extraction from discoveries/fields towards 2030 based on reviews on individual fields, NPD’s estimates of remaining recoverable reserves, the development/forecast for the R/P ratio as of end 2015. Further, the chart shows a forecast for total crude oil extraction from sanctioned discoveries/fields (green area, refer also figure 02) and expected contribution from Johan Sverdrup (blue area) [at end 2015 estimated at 1.76 Gb; [Gb, Giga (Billion) barrels, refer also figure 06] and this development phase is now scheduled to start flowing in late 2019.](https://runelikvern.com/wp-content/uploads/2020/05/8f69a-fig-01-norway-actual-crude-oil-2015-and-forecast-to-2030.png)
Further, the chart shows a forecast for total crude oil extraction from sanctioned discoveries/fields (green area, refer also figure 02) and expected contribution from Johan Sverdrup (blue area) [at end 2015 estimated at 1.76 Gb; [Gb, Giga (Billion) barrels, refer also figure 06] and this development phase is now scheduled to start flowing in late 2019.
My forecast for 2016 is 1.50 Mb/d with crude oil from the NCS.
My forecast shown in figure 01 includes all sanctioned developments and not discoveries (refer also figure 08) and contingent resources in the fields. The forecast is subject to revisions as the reserve base becomes revised (as discoveries pass the commercial hurdles) which likely will fatten the tail of the presented forecast post 2020.
My forecast assumes some reserve growth, but does not include the effects from fields/discoveries being plugged and abandoned as these reach the end of their economic life.
Discoveries sanctioned for development and Johan Sverdrup (with an expected start up late 2019) is expected to slow down the decline in Norwegian crude oil extraction.
The forecast in figure 01 shows that the Norwegian crude oil extraction will be in a general decline in the coming years. Norwegian oil consumption is now around 0.2 Mb/d, and with what is known about Norwegian crude oil reserves, Norway will remain a net exporter of crude oil for another 20 to 30 years.
Discoveries under development and scheduled to start to flow during 2016 – 2019
It is now expected that around 0.05 Mb/d (Mb; Million barrels) on an annual basis will be added during 2016 from start ups of sanctioned developments.
Norway extracted, sold and delivered around 572 Mb of crude oil in 2015. The 7 sanctioned developments are now estimated to add around 640 Mb of crude oil reserves for extraction in the years 2016 – 2019.
Some developments/discoveries are reported under other business areas and are included in these.
My 2015 forecast
In the spring of 2015 I forecast that crude oil extraction from NCS in 2014 would become 1.47 Mb/d and it became 1.57 Mb/d. The reasons for this deviation are several.
Fields that have been in the extraction phase for more than 10 years added more than 40 kb/d, primarily in the Snorre and Visund area while a decline of 25 kb/d for these was expected. It is believed that there is a combination of causes for this like infill drilling where there is a time lag from approvals (during the period with high oil price) until flow.
kb/d; kilo (1,000) barrels per day
The above describes most of the deviations from my 2015 forecast, refer also figure 03.
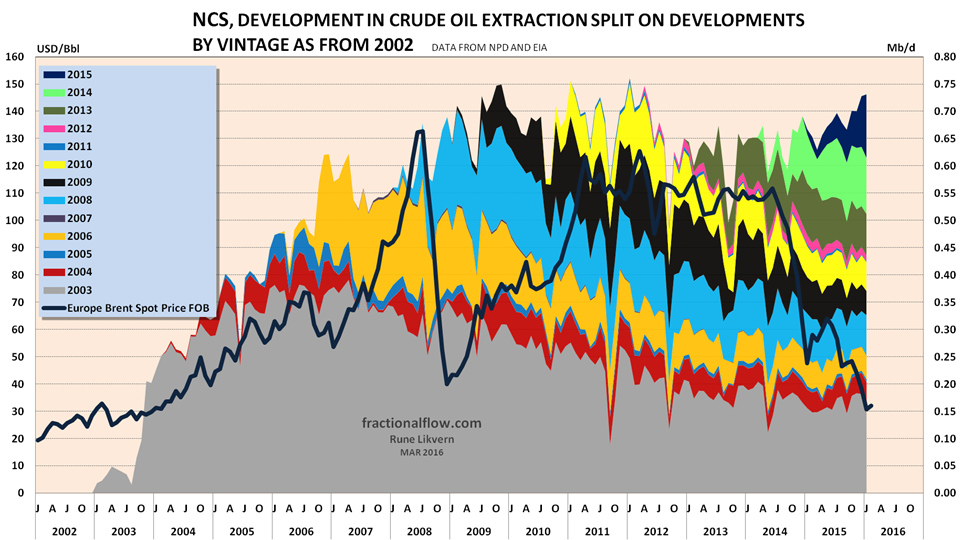
A closer look at actual crude oil extraction

Note the recent years slow down and temporary reversal in crude oil extraction from discoveries starting to flow prior to 2002.
In 2015 around 57% of the crude oil was from discoveries that started to flow prior to 2002.
There is reason to believe that the high oil price in recent years allowed for more infill drilling. Infill drilling allows both for accelerated depletion and increased recovery. Inasmuch as infill drilling has been widely used in recent years, a period with significantly lower oil prices may materialize itself through higher decline rates.
The characteristics of “small” deepwater discoveries/fields (here defined as having less than 100 Mb of recoverable crude oil) are a fast build up, followed by a short plateau (typically 2 years) succeeded by steep declines, typically at annual rates of 15 – 20%, refer also figures 09 and 10.
Several of the recent NCS developments that were sanctioned after the increase in the oil price have after the price collapse been subject to considerable financial and reserves write downs which weakens the companies’ balance sheets and affects their financial capacities for future investments.
The R/P ratio reveals the future trajectory for NCS crude oil extraction
A simplistic description of the R/P ratio (Reserves at year end divided by the Production for that same year) is the (theoretical) number of years the extraction/production level may be sustained using that year as a baseline. In the real world it works somewhat differently, as the reservoir depletes the extraction will (normally) decline. This may result that the R/P ratio remains fairly constant during the decline/tail phase as the reservoir depletes and the extraction declines.
![Figure 05: The chart above shows cumulative NCS crude oil extraction versus the R/P ratio for fields/discoveries in the extraction phase at end 2015 plotted against the right hand scale [black dots connected by a black line]. The red line, plotted against the left hand scale, shows the cumulative portion of the crude oil extraction versus the R/P ratio.](https://runelikvern.com/wp-content/uploads/2020/05/734ab-fig-05-norway-cumulative-crude-oil-production-in-2015-vs-r-over-p-ratio.png)
Figure 05 illustrates that about 50% of the NCS crude oil extraction in 2015 was from 45 fields/discoveries with an R/P ratio of 5 or less.
Broadly speaking reservoirs with an R/P ratio of less than 5 for crude oil should be expected to be subject to steep depletion induced declines in extraction, and year over year declines in the range of 15 – 20% has been observed.
Development of Norwegian crude oil reserves

(Gb; G = Giga, Billion barrels)
Figure 06 illustrates that the biggest NCS discoveries were made early and these discoveries continues to contribute a big portion of total NCS crude oil production.
Figure 06 also illustrates that the growth in the oil price above $50/b in 2005 allowed for increased exploration activities resulting in several successful discoveries with the most prominent being the Johan Sverdrup discovery in 2010.
The chart above is based upon Norwegian Petroleum Facts.
(A site operated by the Ministry of Petroleum and Energy [MOE] and the Norwegian Petroleum Directorate [NPD].)
![Figure 07: The chart above shows the development of total NCS crude oil discoveries since exploration began and as of end 2015 [data from NPD Resource Accounting at end 2015]. The chart is often referred to as a “creaming curve”. The light green portion of the columns shows the development in total extracted, sold and delivered. The dark green portion shows the development in estimated remaining recoverable reserves. The yellow portion shows the development in total estimated reserves in discoveries that are under evaluation and that has not been sanctioned at end 2015.](https://runelikvern.com/wp-content/uploads/2020/05/dbb46-fig-07-norway-creaming-curve-and-status-on-crude-oil-reserves-at-end-2015.png)
The light green portion of the columns shows the development in total extracted, sold and delivered. The dark green portion shows the development in estimated remaining recoverable reserves. The yellow portion shows the development in total estimated reserves in discoveries that are under evaluation and that has not been sanctioned at end 2015.
In the chart is also shown development in the nominal oil price (Brent).
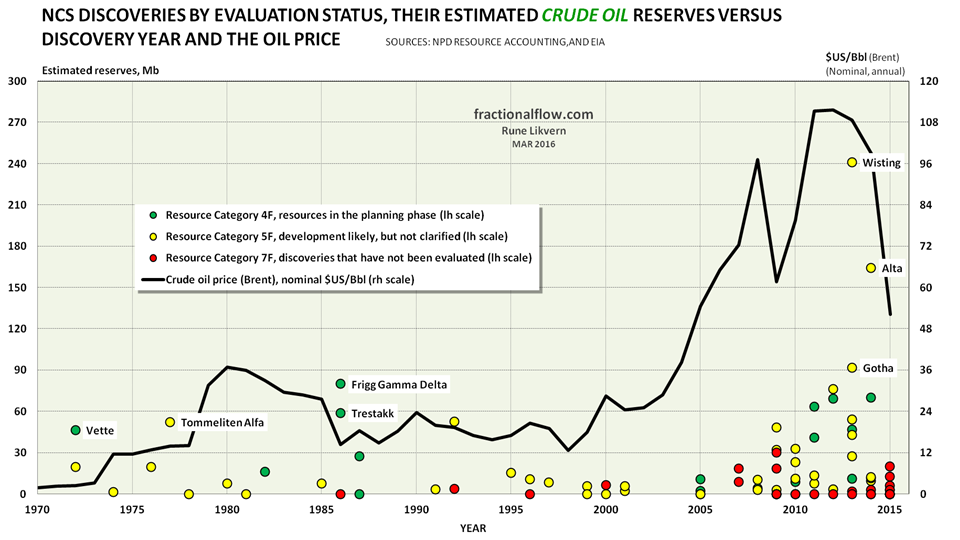
Green circles: Resource Category 4F, in planning phase.
Yellow circles: Resource Category 5F, development likely, but not clarified.
Red circles: Resource Category 7F, not evaluated.
NOTE; For reasons of scaling Johan Castberg (discovered in 2011, Category 4F, 540 Mb) in the Barents Sea and above 72 degrees North is not shown.
Figure 08 illustrates how a higher oil price unleashed a wave of exploration and the results from this. Commercial developments of these discoveries are dependent primarily on the oil price, technological innovations, cost developments and also access to host facilities (processing and utilities support from existing installations) which make some of them time critical with regard to development.
The green dots represent discoveries closest to passing the commercialization hurdle.
Depletion rates
A closer look at the depletion of two deepwater fields show the rapid depletion and high decline rates, which are typical for discoveries/fields with about 100 Mb of recoverable crude oil.
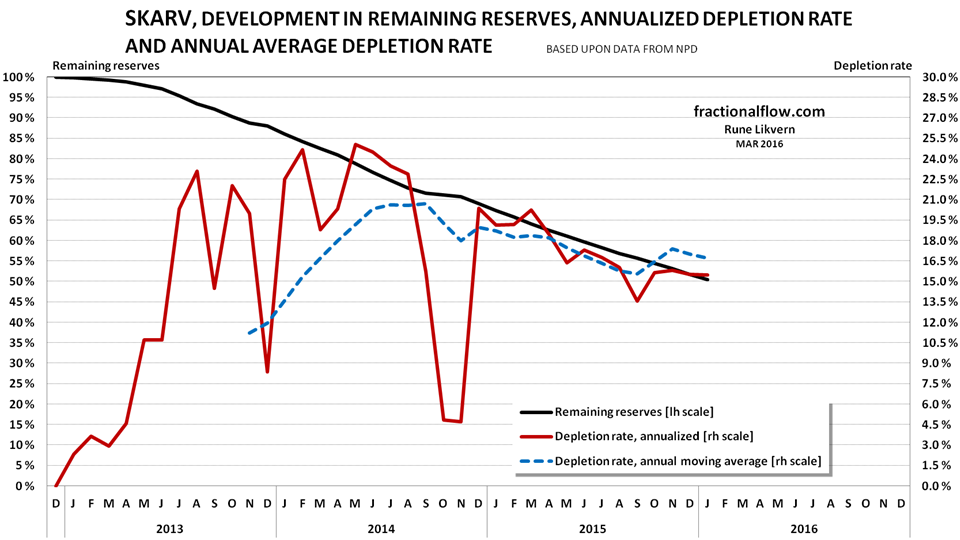
At end 2015 NPD estimated Skarv to have contained 112 Mb with original recoverable crude oil.
The past high crude oil depletion rate for Skarv now suggests a high decline for the near future extraction.
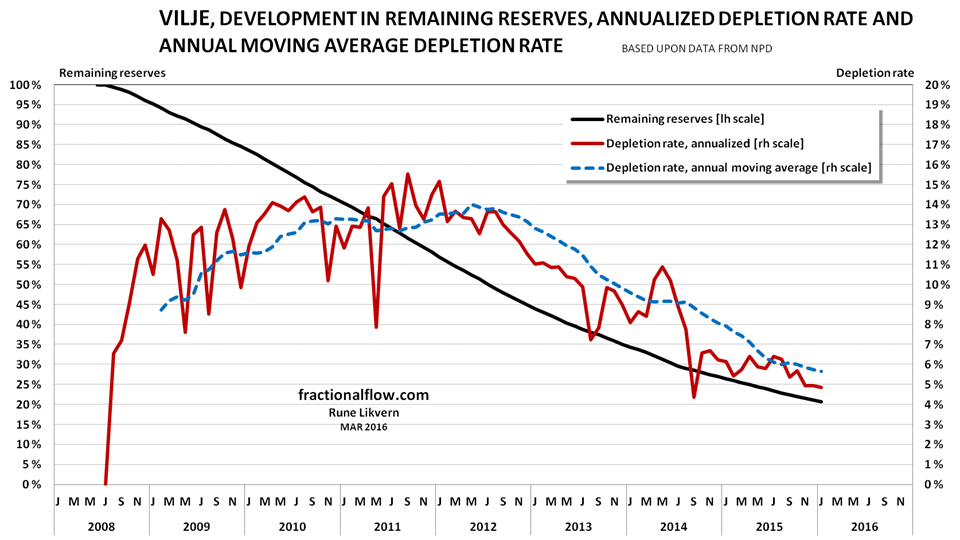
At end 2015 NPD estimated Vilje to have contained 84 Mb with original recoverable crude oil.
In general and with oil prices above $100/Bbl the oil companies’ net cash flows and profits was, and have been struggling from bringing the more expensive barrels to the market. It appears the oil companies, encouraged by the prospects from a sustained high oil price, assumed more debt to go after the costlier oil. This was likely rooted in the expectations that consumers would continue to assume more debt and/or draw down their savings to afford the higher price that would meet the oil companies’ return requirements, assure the health of their balance sheets and enable debt retirements.
The collapse in and the sustained low oil price has hurt the oil companies’ cash flows, returns and balance sheets, prompting all along the line drastic cut backs to their near and medium term capital expenditures (CAPEX) in pursuit of maintaining dividend payments to please the investors, improve financial performance and heal their balance sheets.
In general, future developments of discoveries on NCS require a high breakeven price (above $60/b) and the effects of the oil companies’ CAPEX reductions will impair the pace of developments of discoveries and infill drilling (affecting contingent resources) under evaluation and thus future extraction developments.
…
“The conventional view serves to protect us from the painful job of thinking.”
– John Kenneth Galbraith

One thought on “Norwegian Crude Oil Reserves And Extraction per 2015”
Comments are closed.