In this post I present some selected parameters I monitor which may help understand near term (2-3 years) oil price movements and levels.
It has been my understanding for some time that the formulations of fiscal and monetary policies also affects the commodities markets. Changes to total global debt has and will continue to affect consumers’/societies’ affordability and thus also the price formation of oil.
I have earlier asserted;
Any forecasts of oil (and gas) demand/supplies and oil price trajectories are NOT very helpful if they do not incorporate forecasts for changes to total global credit/debt, interest rates and developments to consumers’/societies’ affordability.
- The permanence of the global supply overhang could be prolonged if consumption/demand developments soften/weakens and it is not possible to rule out a near term decline.
- Recent demand/consumption data for total US petroleum products supplied show signs of saturation which provides headwinds for any upwards movements in the oil price.
- While prices were high many oil companies went deeper into debt in a bid to increase production of costlier oil. Many responded to the price collapse with attempts to sustain/grow production in efforts to moderate cash flow declines and thus ease debt service.
- If the forward [futures] curve moves from a present weak contango (ref also figure 02) to backwardation, this would erode support for the oil price.
- Some suggest that growth from India will take over as China’s growth slows.
Looking at the data from the Bank for International Settlements (BIS) there is nothing there that now suggests India (refer also figure 05) has started to accelerate its debt expansion. The Indian Rupee has depreciated versus the US dollar, thus offsetting some of the stimulative consumption effects from a lower oil price.
The recent weeks oil price volatility has likely been influenced by several factors like short squeezes, rumors and fluid sentiments.
Near term factors that likely will move the oil price higher.
- Continued growth in debt primarily in China and the US. {This will go on until it cannot!}
- Another round with concerted efforts of the major central banks with lower interest rates and quantitative easing.
And/or
- A tightening in the global oil demand/supply balance from whatever reasons.
I also believe that D E M A N D (consumption) developments now are more important than widely recognized and that demand/consumption developments will play a major factor in as from when oil prices will regain support to move to a sustainable higher level.
I now hold it 90% probable that the oil price will enter a new leg down, and that the low in January 2016 could be taken out.
Recently the total US petroleum demand growth had two components
- Growth in consumption, mainly driven by the collapse of the oil price
- Noticeable growth in petroleum stocks (primarily crude oil) since late 2014 driven by a favorable contango.
The combined effects from these grew annualized US petroleum demand by 1.3 Mb/d relative to January 2014 (ref also figure 01). US consumption growth has now stalled, which may suggest saturation from the lower oil price is about to be reached.
![Figure 01: The chart above shows development in annualized [52 weeks moving averages] US total petroleum consumption [blue line] and storage build [red line] both rh scale. The black line, lh scale, shows development in the oil price (WTI). Consumption and storage developments are relative to Janaury 2014 (baseline). NOTE, changes in consumption and stocks are stacked, thus the red line also shows total annualized changes in demand.](https://runelikvern.com/wp-content/uploads/2020/05/0abd1-figure-01-development-us-demand-relative-to-jan-14.png)
NOTE, changes in consumption and stocks are stacked, thus the red line also shows total annualized changes in demand.
A weakened contango (ref also figure 02) will likely reduce demand for storage.
Development in the Spread
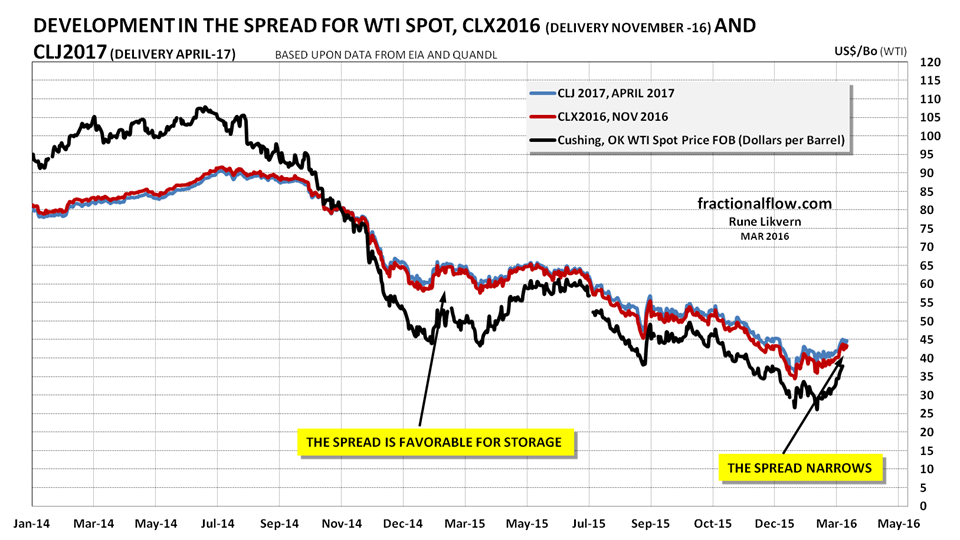
A favorable spread was an incentive to buy crude oil and put it in storage, thus profiting from the future price adjusted for storage/transport costs.
Monetary Policies and Total Global Debt
![Figure 03: The chart above shows the developments in the oil price [Brent spot, black line. The red line is the smoothed one year moving average] and the time of central banks’ announcements/deployments of available monetary tools to support the global financial markets which the economy relies heavily upon. The financial system is virtual and thus highly responsive. NOTES: The chart suggests some causation between FED policies and movements to the oil price. The US dollar is the world’s major reserve currency and most currencies are joined to it at the hip. Oil is priced in US dollar, which makes it highly connected to US monetary and fiscal policies.](https://runelikvern.com/wp-content/uploads/2020/05/e3cdd-figure-03-oil-price-and-some-monetary-tools.png)
NOTES: The chart suggests some causation between FED policies and movements to the oil price. The US dollar is the world’s major reserve currency and most currencies are joined to it at the hip.
Oil is priced in US dollar, which makes it highly connected to US monetary and fiscal policies.

Figure 04 has been lifted from; McKinsey Global Institute: Debt and (not much) Deleveraging.
Figure 04 shows that total global debt has grown faster than global GDP, ref also figure 06.
GDP is a metric describing the [annual] volume of economic activity and thus a poor indicator of what debt carrying capacities an economy has. The growth in debt increases aggregate demand and inflates the GDP number.
In the 6.5 years since Q4 of 2007 and as of Q2 2014 the world added $57 Trillion in debt (or on average close to $9 Trillion each year) while global GDP grew from $53 Trillion to close to $70 Trillion (or an annual average GDP growth of $2.6 Trillion).
Figure 03, 04 and 06 provides some understandings of what brought back demand and provided support for the oil price after the global financial crisis (GFC) in 2008. The growth in debt, on the consumer [demand] side stimulated consumption and the supply side responded by growth in their debt and capital expenditures for costlier oil to meet an expected growth in demand. The oil companies entered into a bet that consumers would be able to go deeper into debt to pay for costlier oil that would allow them to retire their debts.
Fast forward to 2014 the Fed decides to taper their accommodative monetary policies [tightening] while oil supplies starts running above demand resulting in the collapse of the oil price [and other commodities].
Demand have for some time been given support from stock building [ref also figures 01, 02 and 12].
In mid December 2015 the Fed decided to increase the Fed funds rate by 0.25% thus tightening liquidity. This may seem like a tiny rate increase, but since 2007 total global debt levels has increased significantly and some of the added liquidity was used for growth in the US dollar denominated carry trade. The increase in the Feds funds rate strengthens the US dollar and makes it harder for lenders with US dollar denominated debt to service their loans. This affects local demand as more local currencies are used to service a higher dollar denominated debt and thus less [local currencies] will be available for oil demand.
The Supply Side
Near term global oil supply (production) developments appear well understood. Some producers responded to the price collapse by increasing their production in an effort to offset some of the decline in revenues. This sustained and added supplies and contributed to the decline in the price.
Monetary policies affect the markets and the growth in petroleum consumption and the high oil price happened as the world saw strong growth in debt while concerted efforts by the major central banks kept interest rates low to ease service of the growing total debts and entice further debt expansion.
The Demand Side
In reading what follows it will be useful to keep in mind that growing credit/debt adds to aggregate demand and also provides price support.

Figure 05 illustrates that the EMEs, lead by China, continued their growth in debt. Brazil has in dollar denominated terms been deleveraging [the weakening of the Real versus US dollar] since 2014.
A common feature for the presented countries is that relative debt growth [both in local currencies and market value {US$}] started to slow in 2013.
China’s total annual private and public debt growth is now about $3 Trillion (market value).
Some analysts expect India to become the new growth engine of the emerging markets that will allow for meaningful growth in oil consumption and help support the price.
However, looking at India’s monetary policies, their monetary expansion dwarfs China’s and so far there are few things that suggests an acceleration in its debt creation. Total private debt in India is now at the same levels where China was at the start of this century.
If India should enter a more expansive monetary policy it begs the question what industries/developments the increased funds will be allocated towards.
Nothing suggests India is likely to copy China’s debt financed growth and China finds itself now with significant over capacities in several industries that needs to become harmonized with actual demand.
With the debt expansion in the EME’s came also strong growth in petroleum consumption as described here.
![Figure 06: The chart above shows [stacked areas] developments in total private and public debt in Japan (black/grey), Euro area (yellow), US (blue) and China (red). In the chart is also shown [stacked lines] developments on the Gross Domestic Product (GDP) for the same 4 economies. NOTE: All data are market value. The GDP (lines) have been stacked. The bottom line shows Japan, next is (Euro area + Japan) and the top line [China] also shows the total for the 4 presented economies.](https://runelikvern.com/wp-content/uploads/2020/05/a287f-figure-06-development-in-total-debts-for-4-biggest-economies.png)
In the chart is also shown [stacked lines] developments on the Gross Domestic Product (GDP) for the same 4 economies.
NOTE: All data are market value.
The GDP (lines) have been stacked. The bottom line shows Japan, next is (Euro area + Japan) and the top line [China] also shows the total for the 4 presented economies.
The strong debt growth in the Euro area and the US drove much of the global economy until the Global Financial Crisis (GFC) in 2008.
Figure 05 shows that the total debt grew faster than GDP. The figure also illustrates that since the GFC it is primarily China and the US, by their debt expansion (ref also figure 07 below), that has been the engines that sustained global economic growth.
In 2014 China and the US added a total of $5.0 Trillion in (private and public) debt which grew their GDP by $1.5 Trillion. In other words, it took about $3.30 of debt to grow GDP by $1.00.
In 2000 it took (China + US) about $1.70 of debt to grow GDP by $1.00.
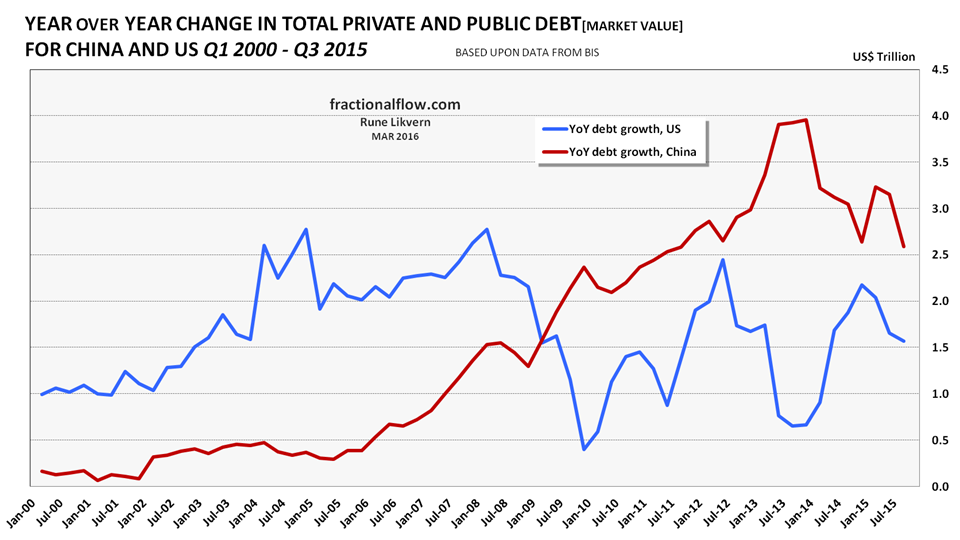
(Lines are not stacked.)
As US total debt growth tanked after GFC (Global Financial Crisis) in 2008, China stepped in and accelerated its, which eased the global slowdown and brought the economy back on its growth trajectory. In the recent years, it has been debt growth primarily in China and the US that has been the engines of the global economic growth.
As described further up it now takes increasingly more and lower priced debt [lower interest rates] to keep the economies growing.
US Total Petroleum Consumption and some selected Products
Conventional wisdom is that a lower price translates into improved affordability and growth in consumption. Affordability is relative, thus lower prices may not result in the expected consumption/demand response.

NOTE: Left hand scaling.
Over the last year annualized total US petroleum consumption (demand) is up close to 2%. This while the oil price dropped about $25/b or declined about 40%.
Following the price collapse of 2008 the consumption declined for about 2 years before it reversed and this happened as the oil price moved higher.
During this price collapse consumption responded swiftly to the lower price, but a continued decline in the price has so far and in recent months not stimulated much growth in consumption.
This may suggest saturation in the market, a lower price gives little stimulation to growth in consumption.
There are some differences amongst the products as shown further down.
Despite a lower oil price US consumption has not reached its high of 2007.
Noticeable growth in US petroleum consumption started in the second half of 2013 while oil prices remained around $100/b. This growth coincides with a fresh growth (acceleration) in total US debt, ref also figure 07.

NOTE: Left hand scaling.
Over the last year annualized US gasoline consumption (demand) is up 3%.

NOTE: Left hand scaling.
Over the last year annualized US distillate consumption (demand) is down close to 4%.

Propane is now cheap (should stimulate demand) and some of it is used as petrochemical feedstock.
US Commercial Petroleum Stocks
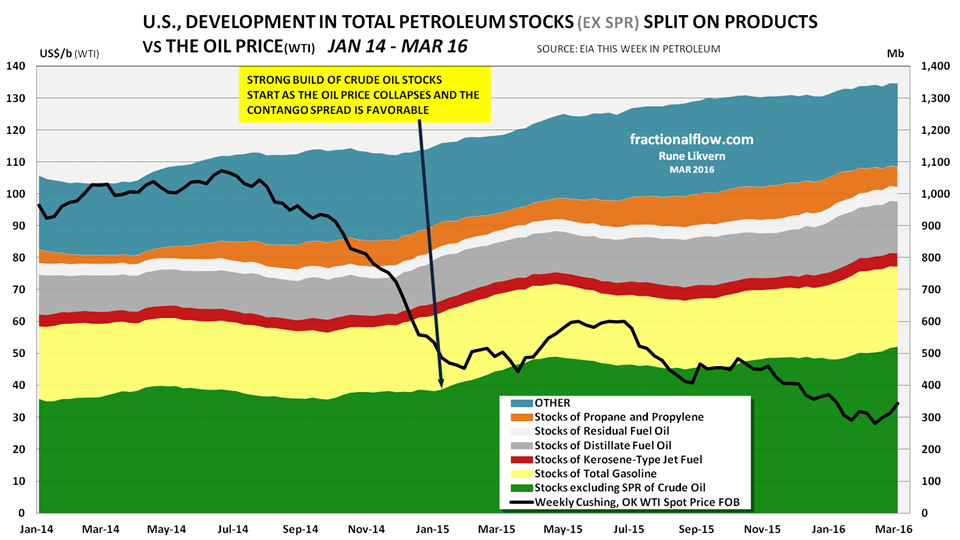
The conditions in the futures market which encourages storage is a favorable contango (the spread).
A flattened contango has the potential to reduce demand for storage, ref also figure 02. Should the forward curve move into backwardation, it could encourage storage withdrawal, which would reduce demand, increase supply and erode support for the oil price.
If this situation is now in development, it will send the oil price much lower.
Summary
The effects of the total growing global debt are slowing economic growth and has the potential to result in a broad recession that weakens demand and thus erodes support for the oil price.
There is no way to rule out that the global supply overhang could last longer than many now expects due to developments on the demand/consumption side.
…..
“Just remember, once you’re over the hill you begin to pick up speed.”
– Schopenhauer

That’s a hell of a post Rune. Yes, Chinese credit floated many boats since 2007. How long can they keep it up??? The rest of world (doesn’t) want to know.
Nice work
Nate
LikeLike
Nate, thanks!
I wonder how many understands the significance of the Chinese debt expansion and the acceleration of it post the GFC?
How long they can keep at it becomes anyone’s guesses, but I saw some estimates that their total debt to GDP are now at/above 300%.
I notice there is some recent chatter about Chinese financial data has become less transparent.
Also lots of articles about the Yuan claiming it is about 30% overvalued (versus US$) and some of those deep in the know are shorting it.
Apparently lots of moving parts here.
LikeLike
Nice article. I also find interesting a recent drop in Saudi money supply
especially seen in m1 deposits http://www.tradingeconomics.com/saudi-arabia/money-supply-m1 though other decline as well.
LikeLike