This post is an update on LTO extraction in Bakken based upon published data from the North Dakota Industrial Commission (NDIC) as per January 2015.
This post also presents a closer look at developments in LTO extracted from the three of the four counties that presently dominates LTO extraction; McKenzie, Mountrail and Williams.
With an oil price below $50/Bbl (WTI) the companies involved in extraction of LTO in Bakken faces two financial challenges;
- The decline in the cash flow from operations reduces funding capacities for manufacturing new wells. A lower oil price also lowers the value of the companies’ assets and borrowing capacities.
- The “average” well with around 90 kb [90,000 Bbls] of flow in its first year is estimated to have an undiscounted point forward break even (that is a nominal break even with 0% return for the well) at around $65/Bbl (WTI). The break even price increases with increases in the return requirement.
In short, LTO extraction at present prices ($45/Bbl, WTI) makes little commercial sense!
![Figure 01: The chart above shows development in Light Tight Oil (LTO) extraction from January 2009 and as of January 2015 in Bakken North Dakota [green area, right hand scale]. The top black line is the price of Western Texas Intermediate (WTI), red middle line the Bakken LTO price (sweet) as published by the Director for NDIC and bottom orange line the spread between WTI and Bakken LTO wellhead all left hand scale.](https://runelikvern.com/wp-content/uploads/2020/05/88849-fig-01-bakken-lto-per-jan-2015.png)
NOTE: Actual data used for this analysis are all from North Dakota Industrial Commission (NDIC). For wells on confidential list, data on runs were used as proxies for extraction.
Production data for Bakken, North Dakota: Monthly Production Report Index
Formation data from: Bakken Horizontal Wells By Producing Zone
Data on wells kindly made available by Enno Peters’ excellent and tireless work.
Cash is now King
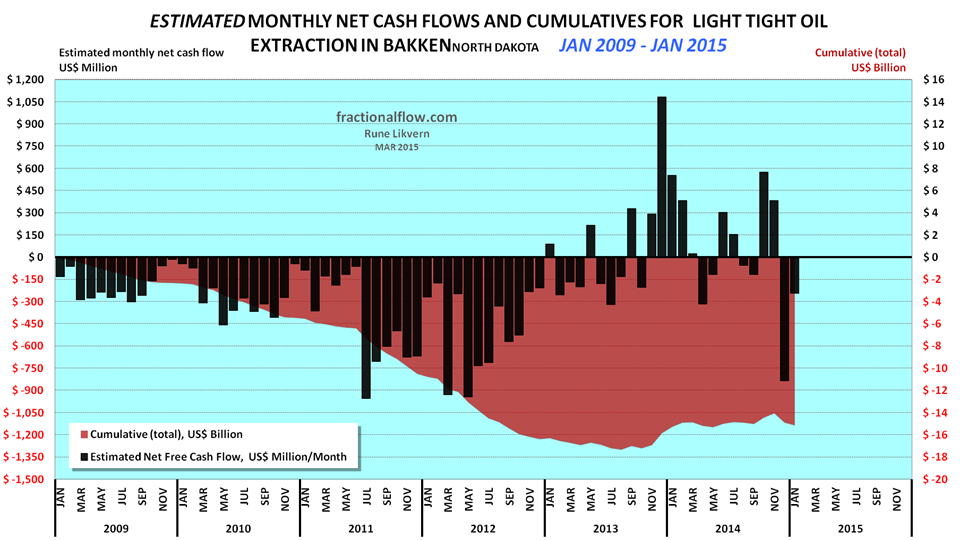
The assumptions for the chart are WTI oil price (realized price which is netted back to the wellhead), average well costs starting at $8 Million in January 2009 and growing to $10 Million as of January 2011 and $9 Million as of January 2013. All costs assumed to incur as the wells were reported starting to flow (this creates some backlog for cumulative costs as these are incurred continuously during the manufacturing of the wells) and the estimates do not include costs non- flowing and dry wells, water disposal wells, exploration wells, seismic surveys, acreage acquisitions etc.
Economic assumptions; royalties of 16%, production tax of 5%, an extraction tax of 6.5%, OPEX at $5/Bbl, transport (from wellhead to refinery) $12/Bbl and interest of 5% on debt (before any corporate tax effects) and income from natural gas/NGPL sales (which now and on average grosses around 1Mcf/Bbl).
Estimates do not include the effects of hedging, dividend payouts and retained earnings.
Estimates do not include investments in processing/transport facilities and externalities like road upkeep, etc. The purpose with the estimates presented in the chart is to present an approximation of net cash flows and development in total use of primarily debt for manufacturing of LTO wells.
The chart serves as a proxy of the aggregate cash flow for all oil companies in Bakken(ND).
Since last summer world oil prices have come significantly down and I hold it likely they will remain low if not OPEC curtails their supplies and/or until the global supply/demand balance tightens.
As of writing the wellhead price in Bakken is around $30/Bbl and the point forward breakeven for the “average” well has been estimated at $65/Bbl at the wellhead, which is about $80/Bbl WTI.
This with a 7% discount rate, average well first year flow of 90 kb [as of writing the average for 2014] inclusive income from natural gas sales, well cost at $8.5M and exclusive of assets retirement obligations, the plugging and abandonment of oil/ gas wells and production installations.
The low oil price causes a noticeable reduction in companies’ total netted cash flows from operations, which now is estimated at about $550M/month for Bakken (ND) (this includes income from natural gas sales, around 1Mcf/Bbl).
CAPEX funding may be increased through selling more debt, assets and issuing new shares of stock.
The Bank for International Settlements (BIS in Basel, Switzerland) in their quarterly review for March 2015 had a special feature on “Oil and debt” where they wrote:
“Where a substantial portion of investment is debt-financed, higher costs and tighter lending conditions may accelerate the reduction in capital spending. Highly indebted firms could even be forced to sell assets, including rights, plant and equipment. As regards production, highly leveraged producers may attempt to maintain, or even increase, output levels even as the oil price falls in order to remain liquid and to meet interest payments and tighter credit conditions.”
This ($30/Bbl at the wellhead) cash flow from operations [about $550M/month] would unabridged fund 65 wells/month.
My model (also presented in the “Red Queen” series at The Oil Drum) estimates it now takes around 130 – 135 net well additions/month in Bakken (ND) to sustain present LTO extraction levels.
If monthly net well additions fall below the “Red Queen” number, Bakken(ND) LTO extraction will decline.
What made LTO extraction in Bakken a success was a high oil price that allowed to leverage with debt to accelerate growth in extraction. A sustained low oil price comes with the reality of lower CAPEX (fewer well additions), deleveraging and decline in LTO extraction. A lasting, low oil price feeds a self reinforcing feedback in search of a new equilibrium.
Companies borrowings capacities
Companies in Bakken levered up (with debt) as higher oil prices resulted in a higher valuation of their assets and likely with the expectations that the oil price would remain elevated.
The companies’ assets are subject to revaluation (performed twice a year) and borrowing capacities becomes subject to redetermination.
If, borrowings in excess of the revised borrowing capacity are outstanding, companies could be forced to immediately repay a portion of the debt outstanding under the credit agreement(s).
This is important as companies that have to repay some of their debts at an earlier point in time following a redetermination, may be left with no other alternative but to take this from the operational cash flow, which further reduces their abilities to fund well manufacturing.
The LTO Break Even Price
Another parameter which is important to keep an eye on is the development to the break even price that meets the companies’ return expectations/requirements. The LTO wells come with individual designs (costs), flow rates and EURs and the break even price is subject to a range of return requirements [my presented numbers are discounted at 7%].
Actual well data from NDIC is used to make estimates of what I will continue to refer to as the “reference/average well”.
Since I started following the Bakken LTO developments this “reference/average well”, and notably since 2013, has experienced some improvements to its total first 12 months LTO extraction and the judges are still out there if the deployment of improved (and likely more expensive) technologies allows for some faster extraction and/or increased total extraction (higher EURs).
Changes in the oil price are the dominant source for changes to the financial returns of LTO wells.
A sustained oil price below $50/Bbl (at the wellhead) will, with a time lag, slow well manufacturing as this is below the profitability threshold for the “average” well. Some companies may for a combination of reasons continue to bring in wells to remain liquid.
Some early indicators for changes in extraction levels is to follow the development of the number of rigs drilling, monthly additions of producing wells and developments in the backlog of wells awaiting fracking/completion.
The 4 counties with the biggest oil extraction

The chart illustrates how growth in McKenzie made it the most prolific county since 2013 and McKenzie has now the wells with the best productivity, refer also figure 05.
What follows is a presentation of the developments as per January 2015 the oil extraction for McKenzie, Mountrail and Willams, 3 of the 4 counties with the highest oil extraction in Bakken(ND).
The presentation of the 3 counties contains two charts each;
- Development in oil extraction by vintage as from January 2008 and of January 2015 where the color gradients represent developments in monthly extraction by year. The dark blue line (on top) shows total oil extraction inclusive of wells pre 2008.
Each chart also shows the development of the nominal oil price, WTI [black line and left hand scale].
The charts illustrate the initial steep declines from legacy wells and how the decline slows with time. - The second chart shows developments in average well productivity by vintage.
Note how the productivity developments change with time and the differences between the counties.
McKenzie County

In McKenzie around 59% of its oil extraction in December 2014 was from wells that started to flow during 2014. NDIC records show that 56 new wells started to flow in January 2015 while total oil extraction declined with 27 kb/d from December 2014.
NDIC records now show that 815 wells started producing in McKenzie in 2014.
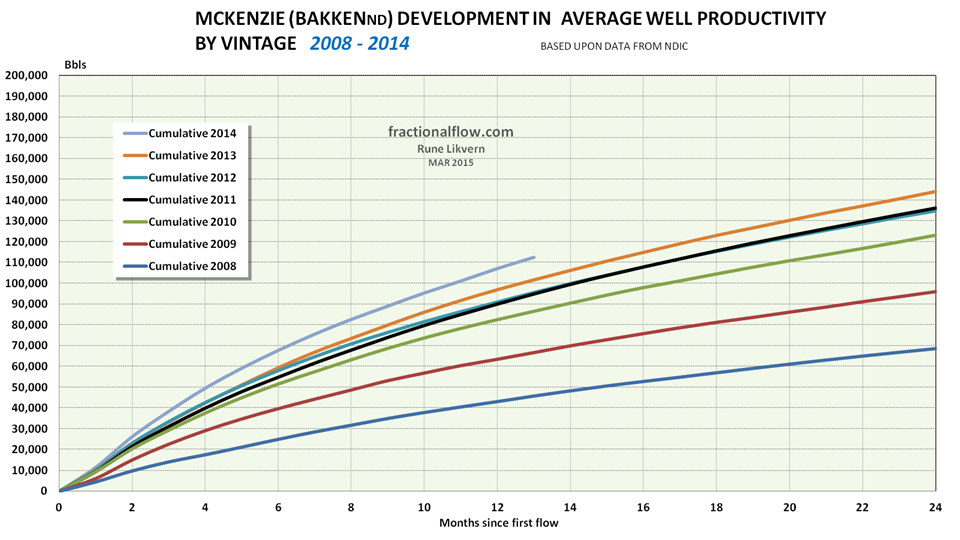
NOTE: Data for 2014 are not complete with first year totals for all wells.
In McKenzie there has, with time, been a steady improvement in well productivity. Earlier I presented developments in McKenzie in this post.
Mountrail County
![Figure 06: The chart above shows developments by vintage in LTO extraction for Mountrail county in Bakken (ND) as of January 2008 and of January 2015 [right hand scale]. Development in the oil price (WTI) black line is shown versus the left hand scale.](https://runelikvern.com/wp-content/uploads/2020/05/8d563-fig-06-mountrail-oil-extraction-by-vintage.png)
Development in the oil price (WTI) black line is shown versus the left hand scale.
So far Mountrail had a high of 292 kb/d in September 2014 and 279 kb/d in January 2015. As shown in figure 03 Mountrail was where LTO extraction in Bakken took off in 2008.
NDIC records now show that 433 wells started producing in Mountrail in 2014.

NOTE: Data for 2014 are not complete with first year totals for all wells.
The NDIC data show that the best wells in Mountrail came early, those started in 2008. Then follows 2013.
So far “average” 2014 wells in Mountrail have been poorer than those started in 2013 and in my post “Are Mountrail’s sweet spots past their prime?” I presented a more detailed analysis of well productivity developments in Mountrail.
Williams County
![Figure 08: The chart above shows developments by vintage in oil extraction for Williams county in Bakken (ND) as of January 2008 and of January 2015 [right hand scale]. Development in the oil price (WTI) black line is shown versus the left hand scale.](https://runelikvern.com/wp-content/uploads/2020/05/57fac-fig-08-williams-oil-extraction-by-vintage.png)
Development in the oil price (WTI) black line is shown versus the left hand scale.
NDIC records now show that 402 wells started producing in Williams in 2014.
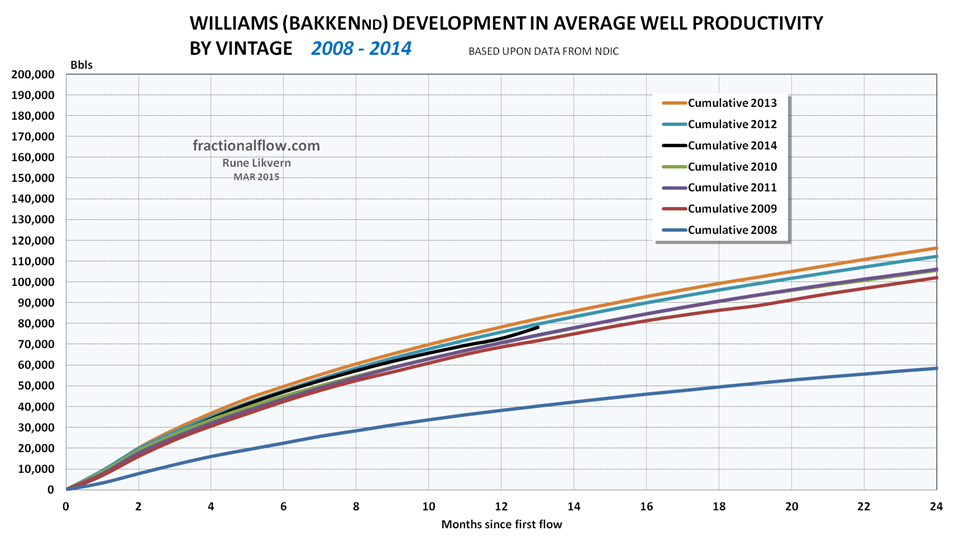
NOTE: Data for 2014 are not complete with first year totals for all wells.
The NDIC data show that the developments in productivity for the average well in Williams has remained more or less stagnant since 2009 with a trend towards lower well productivity in recent years.

Interesting post again Rune. I think Mountrail peaked in September 2014. The average well productivity has been in decline. In the GIS map server you can see that Parshall start to get more densely drilled now too. So then it´s up to Mckensey when the oil price goes up again. If McKensey peaks too, then Bakken has peaked.
LikeLike
Hello FreddyW and thanks!
Declines in well productivity may be offset with increased number of wells, which now does not seem likely with the huge decline in rigs. Then there is the drilled wells awaiting completion/fracking.
Parshall appears to have been the most prolific area having favorable geology.
I will be interesting to follow the developments the next few months.
LikeLike
Yes absolutely. I suppose it depends alot on what the oil price will be. With decreasing average EROEI can the world economy support prices at 120 dollars/barrel at 94 milion barrels/day again? I suspect it may not. In that case investment in tight oil will be lower and that will of course affect production. I think in the autumn we will get a better idea where we are heading.
LikeLike