For some years my general understanding has been that the price formation for most commercial traded materials/products/items (including oil, which is paramount for all economic activities) is very much related to credit/debt growth, total debt levels and the interest rate (the price of money which also is a measure of credit risk).
In an effort to continue economic growth (to save the system and avoid the mother of all deflations) the worlds leading central banks (US Federal Reserve [FED], the most important one as the US dollar also serves as the world’s reserve currency, Bank of England [BoE] and will the European Central Bank [ECB] soon follow?) in recent years resorted to quantitive easing (QE) and lowered interest rates to almost zero to ease the burden from growing total debt loads. QE was intended to be a temporary measure.
The central banks (CB) actions appear to be a lot about preserving wealth ({inflating} assets) while there is little they can do about nature’s CAPITAL, like energy stocks (most importantly fossil fuels).
The CBs likely pursued these measures as they had few other good alternatives. It appears that the CBs policies may also have influenced the oil markets and helped shape the oil companies’ strategies to deal with a tighter supply/demand balance since 2005 by encouraging them to take on more debt and go after the more “expensive” oil.
The world has also become more complex, interconnected and continued good growth in its Gross Domestic Product (GDP) post the global financial crisis.
CBs do not have the capabilities to create cheap, abundant and lasting energy supplies. For some limited time the world’s CBs and their policies may have alleviated (and for some time continue to) some of the effects of the growth in oil/energy prices, though this was likely not their primary objective when they deployed their policies.
WHAT SUPPORTED GROWTH IN OIL DEMAND AND PRICE FORMATION?
Econ 101 refers to the law of supply and demand as the price arbitrator for raw materials, goods and services. The credit/debt will be assumed and mortgaged against promises to honor it in the future and pay interest.
One understanding of our economies is to view them as thermodynamic flows where money is the facilitator that brings energy/thermodynamic flows to and allocate these within the economies.
During the recent decades, growth in credit/debt (borrowing from the future) grew aggregate demand and to some extent negated the price growth induced from demand growth.
The recent years continued growth in credit/debt was stimulated by lowering the interest rate. By keeping interest rates low, less revenues/funds were needed to service the consequences of the growth in total debts, and thus allowed for continued deficit spending and thus support economic activities at elevated levels.
In March 2014 the Bank for International Settlements (BIS in Basel, Switzerland) published a paper titled Global liquidity: where it stands, and why it matters (pdf file, 200 kB) which presented some interesting data and observations about developments in global bank credit/debt levels.
![Figure 01: The 6 panel graphic above shows global bank credit aggregates and the most important borrower regions. The chart at upper left shows that global bank credit more than doubled from 2000 to 2013. In the US [upper middle chart] the growth in bank credit slowed from around 2007 (the subprime/housing crisis) and overall credit growth was continued by increased public borrowing for deficit spending. In the Euro area [upper right chart] the total debt levels led to a slowdown in growth of bank credit post 2008 (or the Global Financial Crisis; GFC) and more recently it appears as deleveraging has started [default is one mechanism of deleveraging]. In the Euro area petroleum consumption is now down around 13% since 2008. Asia Pacific [lower left chart] which includes China, continued a strong credit growth and thus carried on the global credit growth. Latin America [lower middle chart] which includes Brazil, continued together with Asia Pacific the strong total global credit growth. Global GDP in 2013 was estimated at above $70 trillion.](https://runelikvern.com/wp-content/uploads/2020/05/acc6f-fig-01-bis-global-bank-credit.png)
In the US [upper middle chart] the growth in bank credit slowed from around 2007 (the subprime/housing crisis) and overall credit growth was continued by increased public borrowing for deficit spending.
In the Euro area [upper right chart] the total debt levels led to a slowdown in growth of bank credit post 2008 (or the Global Financial Crisis; GFC) and more recently it appears as deleveraging has started [default is one mechanism of deleveraging]. In the Euro area petroleum consumption is now down around 13% since 2008.
Asia Pacific [lower left chart] which includes China, continued a strong credit growth and thus carried on the global credit growth.
Latin America [lower middle chart] which includes Brazil, continued together with Asia Pacific the strong total global credit growth.
Global GDP in 2013 was estimated at above $70 trillion.
INTEREST RATES AND THE OIL PRICE
Low interest rates and easy credit work both sides of the demand and supply equation for oil.
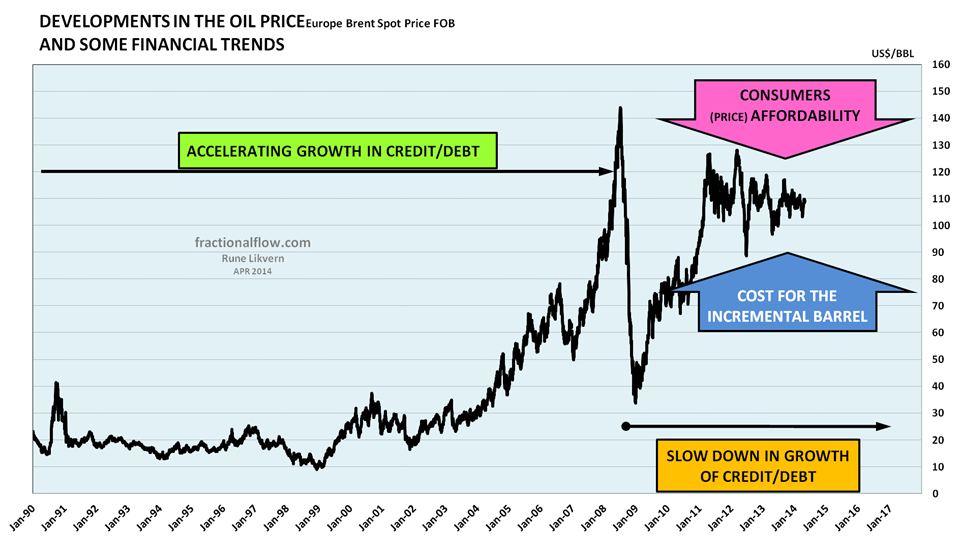
Low interest rates reduce the sovereigns spending on debt services and allows companies to assume more debt in a bid to grow. Low interest rates also inflates consumers’ assets, thus enticing (and enabling) them both to spend more and allows some acceptance for high priced oil. These factors affect spending and thus demand and the price formation for oil.
Another way to look upon consumers’ price affordability is that for the oil companies’ to become motivated to go after the expensive oil, they are dependent [betting] on the consumers’ ability to absorb the costs associated with this. This is now in direct competition with general declining wages [affordability] for consumers.
Low interest rates and easy credit allow oil/energy companies to assume more debt (increase leverage) in their bid to grow/sustain supplies which normally curtails price growth.
Easy credit and interest suppression works for some time and when interest rates start moving up and credit becomes less available, this will likely affect the supply and demand equation for oil.
Higher interest rates will lower demand for oil and thus have the potential to pull the price down.
On the supply side higher interest rates will lower oil companies’ profits from increased debt services which again lowers CAPEX to bring in new supplies. Then add for any revenue/profit effects of price changes, most likely lower prices for oil and gas.
![Figure 03: The chart above shows development in the US 10 year Treasury interest [red line, right hand scale] and the nominal oil price [Brent spot, black line and left hand scale] from 1962 to 2013. In the chart is also shown some major events that influenced the oil price and/or the interest rate.](https://runelikvern.com/wp-content/uploads/2020/05/37ae0-fig-03-us-10-year-treasury-and-oil-price.png)
In the chart is also shown some major events that influenced the oil price and/or the interest rate.
- Which of the parameters described by the 2 lines in the chart above represents the REAL interest rate for the CAPITAL that operates the US economy (and any other economy)?
Hint, do not confuse the price of MONEY with the price of CAPITAL. - Which of the two parameters is most of the decisions about our future now based upon?
- The chart leaves the impression that cheap credit is an effort to offset peak cheap oil.
At some point peak cheap credit will also be reached.
To me key financial/monetary parameters to watch are;
1) Developments in money supply (credit/debt creation)
2) Developments in total debt levels
3) Interest rates (they may reveal something about expectations for future real growth)
These 3 financial/monetary parameters influence demand and supply and thus price formation.
Looking at the chart above it creates the impression that historical oil prices may also have influenced interest rates and apparently something fundamentally changed early in this century.
In the late 1970’s the FED chairman Paul Volker fought inflation, likely induced from higher oil prices from the 1970’s oil shocks with higher interest rates. The chart above shows that interest rates apparently moved in tandem with the oil price. Back in the 70’s the economies were relatively more reliant on oil as the primary energy source (refer also figure 04). High oil prices encouraged more efficient use of oil and substitution (where feasible) from oil to natural gas and nuclear.
As higher interest rates curbed inflation and fuel substitution took hold, oil demand started to decline and the cumulative effects started to affect the oil price that headed lower.
And so did the interest rate.
Growth in oil production from the North Sea, Alaska and Western Siberia reduced the reliance on OPEC supplies and in 1986 Saudi Arabia opened the taps and the market was flooded with oil and the oil price plunged. Note how the yield on the 10 year US Treasury (UST) in the mid 1980’s dropped significantly as the market was flooded with oil and took the oil price down.
From 1986 until early this century the oil price remained fairly stable in the $20/Bbl range. During this period the interest rate was on a steady course towards lower levels.
Apparently the economy entered new territory sometime in the middle of the last decade as it appears higher oil prices (even if the economies had become more efficient) did not do anything to the interest rate that continued its downward trajectory.
With the dotcom and later the housing bubble, monetary policies sought to lower the interest rate primarily in an effort to grow asset prices and entice consumers to take on more debt to continue spending.
This while the oil price went hyperbolic.
As far as there historically has been a linkage between the oil price and interest rates, this link was likely severed by governments becoming the driver of economic growth sometime in the second half of the previous decade (the 00’s).
![Figure 04: The chart above shows the development of the portions of the energy sources used in the world’s energy mixture from 1965 to 2012 [areas plotted against the right axis]. In the chart is also shown the development in the nominal oil price [black line against the left hand axis].](https://runelikvern.com/wp-content/uploads/2020/05/07176-fig-04-world-relative-energy-mix-and-oil-price-1965-to-2012.png)
The central banks’ monetary policies now appear to face new challenges as described in the article Out of Ammo? The Eroding Power of Central Banks (The article is a worthwhile read and contains some good charts about central banks’ balance sheets, interest rates and comments on the financial and the real economy.)
“But then, as deregulation and globalization took hold, the financial sector becomes increasingly separated from the real economy, following the self-fueling logic of speculation, under which a bull market feeds a bull market and a bear market a bear market.
In attempting to control the economy, the central bankers created “a monster,” as former German President Horst Köhler once put it. They have become hostage to the financial industry.”
OIL CONSUMPTION WITH CHEAP, EASY CREDIT
Asset values {consumer wealth} are closely linked to consumers’ willingness and abilities to spend (consume).
Low interest rate improves consumers’ affordability for expensive oil due to cheap credit {less debt service} + the wealth effect from inflated assets => allows oil companies’ to go after more expensive oil => Demand remains high and supports price
High interest rate => reduces consumers’ affordability (due to increased debt services and deflated assets {reduced wealth}) => curtails the oil companies’ abilities {increased debt service} to go after expensive oil => Demand declines and likely also the price
I hold it likely that the cumulative effects of a slowdown in debt growth [possible deleveraging] and higher interest rates will lead to a situation where demand declines faster than supplies, thus exerting a downward pressure on the oil price.
These days there are now more factors that influence the oil price than 2 decades ago.
1) The easy, cheap oil has come to an end
2) Emerging economies have been growing their consumption.
Brazil, Russia, India, China, South Africa (BRICS) is so far different stories as these as of recently have had more expansive credit creation that also allowed for growth in oil consumption and helped cope with the high oil price.
Below I present a closer look at some regions and how their petroleum consumption responded in recent years to changes in credit/debt growth and interest rates.
![Figure 05: The stacked areas in the chart above shows development in petroleum consumption for European Union [EU] [orange area] and US [blue area] from 1990 and as of 2012 [right hand axis].](https://runelikvern.com/wp-content/uploads/2020/05/3869c-fig-05-petroleum-consumption-eu-and-usa-1990-to-2012.png)
Lower interest rates and continued growth in total debt (refer also figure 01) helped cope with higher oil prices and curtailed the decline in consumption.
The causes and effects debate will likely continue.
The chart suggests that the EU and USA now may be able to handle oil prices in the $100 – 110/Bbl range with reduced deficit spending (which still increases total sovereign debt), low interest rates and some austerity measures.
If budgets were to become balanced or result in surpluses, thus allowing for deleveraging, this has the potential to take money out of the system and thus reduce oil demand and weaken price support.
During a few months in 2008 under what is commonly referred to as the start of the global financial crisis (GFC), the global demand for oil declined around 4%, while the price declined about 70% from its peak in July 2008 to December 2008.
No one can issue any guarantees that future financial turmoil could introduce similar discontinuities.
![Figure 06: The stacked areas in the chart above shows development in petroleum consumption for Brazil [green area] and China [red area] from 1990 and as of 2012 [right hand axis]. The development in the nominal oil price [Brent spot] is shown as a black line [left hand axis].](https://runelikvern.com/wp-content/uploads/2020/05/9b332-fig-06-petroleum-consumption-brazial-and-china-1990-to-2012.png)
The development in the nominal oil price [Brent spot] is shown as a black line [left hand axis].
Brazil was, according to IMF data, the world’s 7th largest economy in 2012 and Latin America’s biggest.
From 2005 to 2012 total petroleum consumption in Brazil and China grew with around 4 Mb/d, or 36%, which are about the same total flows EU and USA reduced their consumption with.
![Figure 07: The stacked areas in the chart above shows development in petroleum consumption for European Union [EU] [orange area, US [blue area], Brazil [green area] and China [red area] from 1990 and as of 2012 [right hand axis]. The development in the nominal oil price [Brent spot] is shown as a black line [left hand axis].](https://runelikvern.com/wp-content/uploads/2020/05/9c743-fig-07-petroleum-consumption-eu-us-brazil-and-china.png)
The development in the nominal oil price [Brent spot] is shown as a black line [left hand axis].
Easy credit and low interest rates appear to have supported petroleum consumption in the EU and USA and assisted in coping with the high price.
Higher interest rates (I believe) will result in a demand driven lower oil price that will leave the impression that the world is awash with oil, while in reality it will be an affordability issue. A lower oil price will also make the oil companies spend less to bring in new supplies.
A (temporarily) demand driven lower oil price comes to the prospects of disguising the true state of the world’s crude oil supply systems.
OIL CONSUMPTION FOR NET OIL EXPORTERS
Oil prices also affect demand/consumption in countries that are net oil exporters.
![Figure 08: The stacked chart above shows development in petroleum consumption for those countries that were net oil exporters in 2012 [right hand scale]. The chart also shows the development in the (annual) oil price [black line left hand scale].](https://runelikvern.com/wp-content/uploads/2020/05/fbec4-fig-08-petroleum-consumption-net-exporters-2012-and-oil-price.png)
Note that with the lower oil price in 2009, petroleum consumption in exporting countries declined slightly.
Growth in petroleum consumption for exporters correlates with the oil price. In this post, it is also shown that global growth in total bank credit has played a role in sustaining demand and allowing for higher oil prices. It should be expected that future deleveraging and possibly higher interest rates will affect demand and the oil price. As some of the exporters needs a high oil price to fund their budgets a lower demand and lower oil price is also likely to lower demand for oil in oil exporting countries.
This becomes thus a self reinforcing feedback loop that lowers oil demand further.
HOW OIL COMPANIES RESPONDED TO HIGHER OIL PRICES, EASY CREDIT AND LOW INTEREST RATES
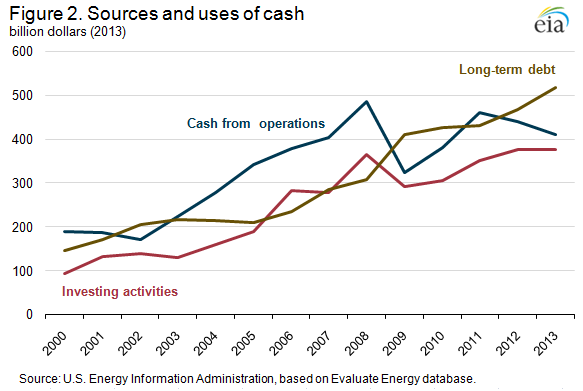
This Week In Petroleum (TWIP) from April 16 2014.
The chart above from EIA considered 42 U.S. and international oil and gas companies that have reported upstream expenditures since 2000. For the last few years, it shows a decline in cash from operations, while long term debt has grown while investment activities remained flat and possibly may decline in the near future. As commercial oil companies have their eyes on returns (oil companies are in the business to make a financial profit) and thus needs to please investors, the effects of lowered investments (CAPEX spending; CAPital EXpenditures) will at some point also affect supplies.
What could be wished for was that the chart also included the development in crude oil production for the oil companies considered.
The growth in debt shows that free cash flow have not sufficed for CAPEX (investments) and dividend payments this while oil prices remained high and stable as from 2010.
Low interest rates compelled oil companies to issue more debt that was used for acquisitions, stock buybacks and CAPEX.
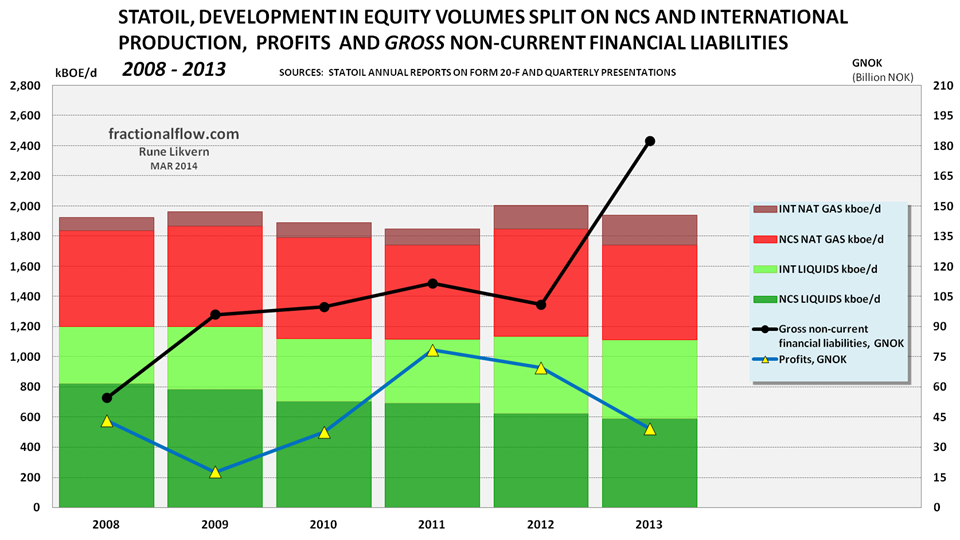
Entitlement volumes are affected by effects from Production Sharing Agreements (PSA).
What the chart above illustrates is that the oil companies in a bid to go after the more expensive oil (like the Arctic, shale oil, the deeper water, etc.) took on more debt and so far this has materialized in little production growth for liquid petroleum (primarily crude oil) and with little or no effect on returns.
Higher interest rates will divert more of the companies’ revenues towards debt service. As higher interest rates bring with it the prospects for a lower oil price, the cumulative effects of these will further impair the companies’ investment activities.
Higher interest rates and lower oil prices will make the oil companies curtail their capital expenditures and defer plans for exploration and developments that require a higher oil price to meet their requirements for return.
Companies stock buybacks may appear as management is aware of the growth prospects and therefor becomes more occupied with stock rigging to please shareholders.
RENEWABLES RESPONSE TO EASY CREDIT AND LOW INTEREST RATES
Taking a look at the growth in renewables, solar and wind, their period of hyperbolic growth coincides with low interest rates and easy credit. This growth was also buoyed by policies (subsidies) that was intended to increase the generation of electricity from more environmentally friendly sources and reduce the dependency on fossil fuel imports.
![Figure 11: The chart with the stacked areas shows the world’s growth in the wind (turquoise area) and solar (yellow area) energy consumption with 1990 as a baseline. The energy unit used is Million Tons of Oil Equivalents [MTOE].](https://runelikvern.com/wp-content/uploads/2020/05/5174f-fig-11-solar-and-wind-1990-to-2012.png)
SUMMARY
To me it now appears we will move into uncharted waters where the effects of complex nonlinear dynamics sourced from total global debt loads, central banks yield curve shaping [long bond price fixing] to ease the burden from total debt loads and to facilitate issuance of more credit/debt, are all about to meet up with the realities from less accessible and more expensive resources (CAPITAL) needed to fuel continued and real economic growth. The durability of the central banks’ policies and what other tools that may be deployed remains to be seen. These policies will also affect energy affordability.
Our concept of CAPITAL is distorted as the financial system does not recognize energy for what it is and our decisions are based on man-made constructs like the interest rate (nature does not operate with interest rate).
Credit/debt growth together with low interest rates appears to have played a part in both growing demand for oil and negating the price growth from a tighter supply and demand balance.
If interest rates move higher for whatever reasons this will also affect demand for oil and thus oil prices. A global deleveraging by any means (down payment of debt, defaults, etc.) will affect the demand for oil and thus the price.
A lower demand for oil now, as supplies show signs of growth, should if the market was left to itself, result in lower prices. Interference from cartels and/or events of major geopolitical characters may counter any organic market corrections to the oil price.
…
As I did the research and discussed the contents of this post, “Herbert Stein’s Law” repeatedly came into mind, which Stein expressed as;
“If something cannot go on forever, it will stop.”
By which he meant that if a trend cannot go on forever, there is no need for action or a program to make it stop, much less to make it stop immediately; it will stop of its own accord.
“Wisdom comes to us when it can no longer do any good.”
- Gabriel García Márquez, Love in the Time of Cholera
A lesser known corollary is;
“Experience is something you get, just after you do not need it.”

Hi Rune!
Great analysis on the interlinked relationship between energy and credit. After the financial crisis it looks to me that the worlds central banks overtook the issuance of credit from the private banking sector to keep the energy spigot open to society a little longer (kicking the can). So we are basically pulling future “sunlight” forward for immedieate consumption to avoid the emergace of peak oil. To me this seems to create greater energy constraints in the future, but peak credit will probaly “hide” (as you mentioned) the energy constraints through lower oil prices. It is also interesting in your analysis to note the relationship between renewables and credit. How will this part play out when credit availability declines? Will it be the end of investment in renewables such as wind and solar? What is the incentive to invest in renewables (except for climate reasons?) if oil is 40 $?
I looks like our governments are in a race with depletion (and they are loosing) and their only weapon is creative ways to keep aggregate credit growing with low interestrates….we have entered a “red queen” scenario….I am wondering how this all will play out in our complex interlinked global society….will we muddle through or follow that way of other comlex societies? Tainter’s book “The collapse of complex societies” shows that while invasions, crop failure, environmental degradation, political corruption etc are contributing factiors to collapse, the ultimate cause is diminishing returns on investment in social complexity.
LikeLike
Hello,
And thanks for the vote of confidence.
The central banks are under political control so actually it was governments that became prime driver, through credit/debt issuance, of economic growth post the Global Financial Crisis (GFC) that started in 2008.
To me it appears as the use of more credit/debt and low interest rates for some time will continue to mitigate the effects from diminishing returns, and I do not believe there are any easy ways out. In short we are faced with two options;
1) The hard one
2) The harder one
With regard to renewables I have seen a lot of mentioning that world total investments in renewables were down in 2013 relative to 2012. Germany (their Energiwende) has discovered that renewables are expensive and increasingly uses more (cheap) domestic coal for electricity generation. A slowdown in credit/debt growth and higher interest rates I expect will become a contributing factor to lower investments in renewables.
Thus we already see evidence of societies opting for cheaper energy.
If my observations about the described interconnections are basically correct with regard to cheap and “easy credit” working both sides of the oil supply/demand equation and allows $100/bbl oil to be affordable, then at some point in time credit/debt growth will slow (already happening) and interest rates will come up (Fed hints about increasing rates [the FEDeral funds rate in general greatly influences interest rates] sometime in the near future). This will IMO reduce demand for oil and bears with it the prospects of a declining oil price.
People are following the cues from the “hive” and try to accumulate wealth and to me it appears as most confuse money with CAPITAL (like energy).
Tainter’s book is a very good read and also describes how a society reinvents when faced with the law of diminishing returns.
LikeLike
Thanks for your great response! You are indeed right that it was the government that became the primary driver of credit/debt issuance after GFC. Also, good observation about Germany’s increase in domestic coal for electricity gain. I did not know that. I guess that is a telling sign for what might happen to investments (or lack of) in renewables….
Regards to CAPTIAL: I like to percieve money as abstract status markers, and thereby focus on REAL capital such as natural, built, human and social capital (more in line with E F Schumacher’s primary capital). This helps me gain some perspective on which capital that matters.
LikeLike
It was wished for that more people become to discover the differences between money and real CAPITAL (natural, human, social, built).
I do not believe we will run an economy without money; it is more a question of what kind of money and its role.
Money is a convenient utility that performs some basic functions;
• A mean to connect seller and buyer
• A mean for relative metering products and services
• For budgetary and accounting purposes
• A mean to store surpluses/wealth
LikeLike