In this post I present some hard data from the Norwegian economy, which in the recent decades show high correlations between total debt growth and the oil price. Presently the total debt growth from some sectors runs at an annual rate above 8% of GDP.
I also present my thoughts and observations about historical developments and what may lie ahead.
The economic undertows now suggest for a sharp downturn in the Norwegian economy. A deep look into the public data from Statistics Norway (SSB) reveals that it was the growth in debt, primarily acquired by the Norwegian households, that was and still continues to be a major and less acknowledged contributor to the recent growth success of the Norwegian economy.
The primer for the strong nominal growth in debt was likely the growth in the oil price starting back in 2004. The oil price has remained at a structurally higher level at around $100/bbl.
Developments in the Norwegian economy have been tightly linked to movements of the oil price and the value of petroleum exports.
- It is widely recognized that the growth in the oil price spurred more investments for exploration and developments for petroleum from the North Sea.
- With the increased Norwegian North Sea petroleum activities followed an acceleration in households, non financial and municipalities debt growth.
![Figure 1: The stacked columns in the chart above show the development in the 12 Months Moving Totals (Annualized) for Norwegian exports split on petroleum (oil, condensates and natural gas [green columns]) and exports exclusive of petroleum [black columns]. The orange line shows the development in the 12 Months Moving Totals (Annualized) for total imports and the pink line the 12 Months Moving Totals (Annualized) for the trade balance. 6 NOK ~ 1 USD By clicking on the chart a bigger version opens in a new tab/window (goes for all the charts in this post).](https://runelikvern.com/wp-content/uploads/2020/05/91a2c-fig-1-norway-trade-figures.png)
6 NOK ~ 1 USD
By clicking on the chart a bigger version opens in a new tab/window (goes for all the charts in this post).
As the data on imports are not broken down by sectors, there is good reason to believe that a major portion of the import growth originates from purchases of goods and services for the petroleum industry.
The value of Norwegian petroleum exports is now expected to decline in the near term with the decline in production, primarily of crude oil and by the end of this decade also natural gas.
Anyhow the data were whipped around for confessions, it turned out the Norwegian economy now appear to approach a major turn around.
Note to reader: This post is lengthy (and rich with descriptive charts!) and may be perceived as hard to digest, however it is my hope and belief that hose who take the time and read it, give it some reflection and make their own queries, may be rewarded with some improved and valuable insights into the recent workings and drivers for the Norwegian economy. Readers may use the opportunities to post questions/comments (automatic shut off after 14 days) or contact me using the spam protected E-mail: rune [dot] likvern [at] google [dot] com
Directly and indirectly around 90% of the profits from the Norwegian petroleum sales are transferred to and invested by the Norwegian Government Pension Fund Global (GPFG, a sovereign wealth fund). This monetary surplus does not directly enter the Norwegian economy.
Indirectly a regulation in effect allows the government for an annual expenditure of maximum 4% of the market value from this sovereign wealth fund to be allocated for government spending.
![Figure 2: The chart above shows developments in total investments in the petroleum activities [black line] broken down into investments [red line] and exploration [blue line] all plotted against the rh scale. The (nominal) oil price [yellow dots connected by grey lines] are included and plotted against the lh scale.](https://runelikvern.com/wp-content/uploads/2020/05/0fdec-fig-2-norway-petroeum-investments-and-exploration-versus-oil-price.png)
The (nominal) oil price [yellow dots connected by grey lines] are included and plotted against the lh scale.
Developments of petroleum discoveries in the North Sea are characterized by long lead times and financially heavy front loaded (capital intensive). When the development of a discovery has been sanctioned, any reversing of the decision becomes like turning a heavily loaded supertanker plowing the waters at full speed. The development will move forward despite any swings and outlooks for petroleum prices.
In the post “A closer look at some recent developments offshore Norway“ I presented how some of the recent Norwegian petroleum developments had fared both with regard to expected production and financially.
In the continuation of reading this post, keep also in mind:
Demand is not what one wants, but what one is willing and capable of paying for.
DEBT GROWTH FOR HOUSEHOLDS, NON FINANCIAL AND MUNICIPALITIES
![Figure 3: The stacked areas in the chart above show development in total debt (municipalities [grey area], non financial [orange area] and households [blue area] plotted against the rh scale). The black line, plotted against the lh scale show year over year change in total debt for these sectors. 6 NOK ~ 1 USD](https://runelikvern.com/wp-content/uploads/2020/05/973dc-fig-3-norway-some-sectors-total-debt-and-debtgrowth.png)
6 NOK ~ 1 USD
![Figure 4: Chart above shows Norwegian households’ [blue columns], non financials [orange columns] and municipalities [grey columns] 12 Months Moving Totals (annualized) change in debt plotted against the rh scale. The green dots connected by black lines show the development in the nominal oil price (Brent spot) plotted against the lh scale.](https://runelikvern.com/wp-content/uploads/2020/05/5c169-fig-4-norway-annualized-debt-growth-versus-oil-price.png)
Debt is useful when invested in productive undertakings (for capital formation) and also for financing major purchases. At some point the usefulness of more debt diminishes.
CORRELATION ANALYSIS
For what it was worth, developments in total debt growth and oil price were subject to an extensive correlation analysis spanning various periods shown in figure 4. For the period Jan 89 – Sep 13 the correlation of total debt growth (households and non financial) with the oil price had a high correlation of 0.76. As the periods analyzed were shortened (using Sep 2013 as an end point) the correlation weakened and presently it is difficult to find any correlation between debt growth and the oil price. This may also be perceived from figure 4.
What now keeps the debt growth at high levels may of course be a combination of several factors, but the high oil price still ensures high investment levels for petroleum exploration and developments together with healthy profits from sales of petroleum.
It may be that the prospects for continued elevated petroleum investments for the foreseeable future instills confidence with the households who then continue to take on more debt within their capacities.
Requirements from the Norwegian regulatory authorities with regard to the banks’ equities (capitalization) will at some point introduce a ceiling to how much Norwegian banks may be allowed to lend to businesses and households. There are limits both to the debt carrying capacities from the entities that borrows and those who lends. As of now and in theory it appears that Norwegian households still have remaining capacities to take on more debt.
NORWEGIAN HOUSEHOLDS
![Figure 5: The diagram above shows development in Norwegian households’ change in debt by 12 Months Moving Totals (Annualized) [red line plotted against the rh scale]. The chart also shows the annual rate of change [black dotted line plotted against the lh scale]. NOTE: The discontinuities (like for 2012) are according to Statistics Norway due to alignment of reporting to accepted international standards.](https://runelikvern.com/wp-content/uploads/2020/05/0f866-fig-5-norway-households-annualised-debt-growth-and-relative-growth.png)
NOTE: The discontinuities (like for 2012) are according to Statistics Norway due to alignment of reporting to accepted international standards.
Note how household debt growth in 2004 started to accelerate simultaneously with the growth in the oil price and the debt growth for non financials, see also figures 4 and 6.
Household debt growth decelerated with the Global Financial Crisis in 2008. This deceleration in debt growth also affected housing prices as less money was lent into existence to support and bid up prices.
With the growth in the oil price in 2010/2011 came a new cycle of debt growth from households that helped bid up home prices.
The mechanisms supporting and bidding up home prices in Norway are the same as those at work in the US housing market which led to a decline in home prices as the bubble burst in 2007.
Who temporarily gains from these (pyramid like) conditions?
Short answer; Everyone.
The households experience the temporarily illusive effect of wealth growth created by increased purchasing power from acquiring more credit/debt. The home construction and furnishings businesses gains from increased demand and sales. The government from increased employment and collected taxes and duties from all these activities and transactions which grows their revenues and makes it possible to finance popular promises. The financial institutions gain from growth in the demand and the expanded base for their main product; debt. The wage earners from wage growth created from more money in circulation.
A home is the biggest purchase in their life for a major portion of the population. It is commonly perceived as an investment, but in the real world most homes are merely objects of consumption.
Who will for a long time be left holding the bag when the bubble bursts?
Short answer; Everyone.
The economic laws governing the Norwegian economy are identical to those governing the US, UK, Greece, Portugal and many more. There are of course both structural and real differences between economies.
A lower debt growth followed with the probabilities for deleveraging is the fuel for deflationary contraction.
Lower debt growth introduces less demand for homes (as fewer will have the capacities to bid and most importantly, to pay). Lower demand for homes translates into lower construction activities, increased unemployment, lower demand for furnishings and other goods and services and thus becomes contagious for several sectors of the economy.
The government will see their revenues decline from lower debt growth (and even more if households start reducing their total debt). At the same time a growing unemployment will call for increased benefits and thus increased government expenditures.
In the wake of lowered debt growth home prices will decline and some late entrants could find themselves underwater (more mortgage than equity from the market value of their colatteraled home).
Perhaps there is some solace to be found from George Carlin’s (maybe somewhat cynical) view on a house:
”A house is just a place to keep your stuff while you go out and get more stuff.”
NORWEGIAN NON FINANCIALS
![Figure 6: The diagram above shows development in Norwegian non financial change in debt by 12 Months Moving Totals (Annualized) [dark blue line plotted against the rh scale]. The chart also shows the annual rate of change [dark grey dotted line plotted against the lh scale].](https://runelikvern.com/wp-content/uploads/2020/05/131e0-fig-6-norway-non-financials-annualized-debt-growth.png)
What followed after the oil price collapse is interesting; the non financial momentarily started deleveraging. With some time lag the growth in the oil price from 2009 created a secondary high in 2012 for the debt growth, followed by deceleration and now the debt growth appears to have stabilized at an annual rate of 4%.
Non financial is primarily businesses (inclusive oil companies, oil service companies and exclusive financial institutions) were encouraged by the higher investment levels created from the higher oil price to increase their borrowing in a bid a meet increased demand for their products and services. This helped employment stay at high levels and also contributed to a healthy wage growth.
A healthy wage growth for employees increases their debt servicing capacities and the prospects of servicing more debt and its future down payment thus fueled more borrowing from households (see also figure 5 above).
Non financial (businesses) will not grow their debt if they do not see outlooks for financial growth (profits) that justifies buying more debt.
Even if the government requests the financial institutions to reserve debt capacities for businesses, this request carries little value if the businesses do not see any potential for future financial growth.
Note the decline in investments in figure 2 from 2009 to 2010 with the deceleration in debt growth for the same period in figure 3 and further the deceleration in debt growth for households in figure 5 and non financials in figure 6.
Figures 4 and 6 show that non financials (businesses) just after the oil price collapsed in 2008 started rapidly lowering their debts which cause deflationary undertows.
One indicator for how businesses perceive future developments could be if more asset sales are carried out as a mean of reducing the total debt overhang (or leverage), this is often presented as “targeting financial performance”.
NORWEGIAN MUNICIPALITIES
![Figure 7: The diagram above shows development in Norwegian municipalities change in debt by 12 Months Moving Totals (Annualized) [dark blue line plotted against the rh scale]. The chart also shows the annual rate of change [black dotted line plotted against the lh scale].](https://runelikvern.com/wp-content/uploads/2020/05/f6523-fig-7-norway-municipalities-annualized-debt-growth.png)
Municipalities debt growth appears with some time lag to roughly follow the debt growth from other sectors.
The media (from what I have seen and so far) recently reported about one municipality that needed to go deeper into debt just to pay for pension promises.
Even if the municipalities’ annual debt growth has declined from 14% in 2010 to recently around 8%, it does not require a PhD in mathematics to understand that even the lowered debt growth is not sustainable.
Municipalities have also to balance their budgets and as figure 7 shows in recent years this was achieved by taking on more debt. A general economic slowdown will also affect the municipalities’ incomes and erode their debt carrying capacities, leaving them to look for and manage areas that can take cuts in their budgets and thus scaling down on promises made.
THE OIL PRICE

The dynamics now at play for the oil price has (as I see and have seen it) remained the same since 2010 as illustrated above. I expect this dynamic to be prevalent in the near future and hold now a decline in the oil price (absent any major geopolitical disruptive event) as most likely.
The trajectory of the oil price towards its high in 2008 has the characters of a bubble buoyed also by the influence of speculative forces which thus was predestined to blow. And it did!
The chart above also describes an interesting trend since 2010, the “highs” are becoming lower and the “lows” higher, suggesting the converging of what the producers need to profitably develop new discoveries with what the consumers can afford.
Presently many oil companies have bet their financial future on consumers’ abilities to continue to go deeper into debt in order to buy the more expensive oil (from more exotic areas like the Arctic) which will allow the oil companies to retire the debts acquired for the developments of these sources.
THE EXCHANGE RATE FOR THE NORWEGIAN KRONE IN 2013
Fiat money is all about trust, faith and the ability to enforce its value. An economy showing strong organic growth may see that its currency strengthens (gains) relative to those of its trading partners. The oil price has been very stable in 2013 moving in a band between $100 – $110/bbl.
As the production and sales of petroleum constitute a big portion of the Norwegian economy it should be expected that the exchange rate for the Norwegian Krone should have remained pretty stable.
It turns out the Norwegian Krone in 2013 has lost somewhere between 10 – 15% of its purchasing value relative to the currencies of its most important trading partners, refer also to figure 9 below.
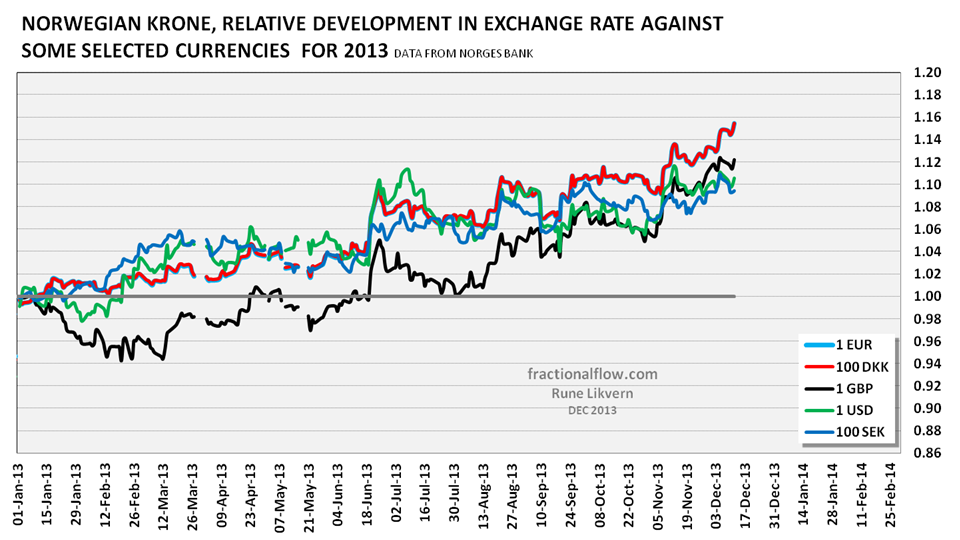
HOW TO READ THE CHART: If the value moves below 1 it means the Norwegian Krone gains purchasing power (appreciates) versus its trading partners. If the value moves above 1 it means the Norwegian Krone loses purchasing power (depreciates) versus its trading partners.
The chart above begs the question;
Is the present weakening of the Norwegian Krone of a cyclical or structural character?
A currency’s movement is also a reflection of expectations from investors and other affected market participants. Someone (upon seeing the chart above) suggested that it could be that the outside world gradually have come to realize what all the true drivers behind the Norwegian growth success were. Meaning that all the economic growth was not organic, but supercharged during several years from growing amounts of debt. These same market participants know what happens as the growth in total debt slows down and eventually reverses.
Many of these investors/market participants have likely and recently seen this movie play out in a theater nearby.
SO WHERE DO WE GO FROM HERE?
What occurred to me from doing the research/analysis for this post (actually a process through several years) supplemented by several enlightening lengthy discussions with many international experts, is how responsive the financial system/parameters in Norway have been for movements in the oil price. This responsiveness could become amplified as households, non financial (businesses) and municipalities approach their debt carrying capacities at a time when Norwegian petroleum production by historic levels still is relatively high albeit in terminal decline.
Financial systems are virtual and thus highly responsive, meaning that changes occur rapidly.
Then add that humans are what they are, meaning that the psychology of crowds is a potent and unpredictable force.
The Norwegian economy, now buoyed by high petroleum exports and activities related to petroleum acts no different from any other modern economies. The Norwegian economy is governed by the same laws and mechanisms as any other advanced economy.
I have previously posted my forecasts on Norwegian crude oil and natural gas production which show that I expect the production and thus exports are both in terminal decline.
(The posts are in Norwegian and anyone not fluent in Norwegian that take any interest is advised to use Google translate (or similar) for a close readable proxy in their native).
Gross Domestic Product (GDP) is widely used to reflect the health of an economy and is expressed below.
GDP = Consumption + Investments + Government expenditures + Exports – Imports
(I , and many others look at the present GDP metric as greatly flawed, but for what it is worth it will be referred to in what follows.)
Growth in GDP was, besides the growth of petroleum exports, petroleum activities and government expenditures, primarily facilitated by growth in consumer debt which supercharged consumption. Norwegian households has been and is the sector with the fastest debt growth in both nominal and relative terms, albeit now at a slower rate, but still above what is expected for growth in households disposable income.
Deleveraging (reducing total debt overhang) is by definition deflationary.
A decline in total exports would ceteris paribus (all other things remaining equal) reduce the GDP. Then throw in the prospect from reduced investments and consumption from lower growth in debts which leaves only growth in government expenditures to sustain or grow the Norwegian GDP.
This is where the proverbial rock gets closer to the hard place.
As all sectors start to reduce their assumption of debts (and probably starts deleveraging), the government’s income will decline, while expenditures are more likely to grow (from higher unemployment and benefits paid). Add in the potential from reduced trade surpluses (primarily from declining revenues from petroleum exports) leaves primarily government expenditures to grow to make GDP grow.
The sovereign wealth fund (GPFG) leaves now a little room for increased government spending, but the sovereign wealth fund is also subject to changes in its market value from international financial developments.
Finding themselves in a reality with declining incomes and growth in expenditures, the government may solve this through a combination of measures; increased taxes (direct and/or indirect; this does not solve the fundamental problem as this is mainly shifting some of the same money from private consumption to government spending), reductions in the promises made (lowering public entitlements [health care, pensions, education, public employees’ wages etc.] all presented behind some edible rhetorics) and temporarily take on more debt (Norway’s sovereign debt is presently relatively low) betting on a future resumption of economic growth.
So how was all this facilitated?
The recipe for effective control of collective behavior is through “perception management” (targeted use of the mass media) has been known for a long time and improved for a century;
“Men (people) are rarely aware of the real reasons which motivate their actions.”
– Edward Bernays, “Propaganda”, 1928
SUMMARY
What has been shown in this post is how a near quadrupling of the oil price during a few years in the previous decade set in motion a chain reaction in Norway that increased borrowing from all presented sectors. Debt is a potent steroid for economic growth and is assumed with the expectation that financial growth over time will ease the burden of servicing it and diminish its relative influence on future financial capabilities.
As this growth in debt slows and/or reverses for any reason or combination of reasons, the debt overhang becomes a liability that in aggregate has the potential to create a strong, lasting and self reinforcing deflationary contraction.
Apart from production and sales of petroleum the Norwegian economy was and has increasingly become more dependent on primarily the households’ continued willingness and abilities to take on more debt for consumption.
I chose to name this blog “Fractional Flow” as this also aptly describes what happens when growth in credit/debt reverses. GDP growth has for decades been turbocharged with high amounts of debt and GDP is all about the (credit) flow.
Credit/debt acts as lubricants for an engine (economy) and if the engine sees its flow of lubricants dry up (declining credit/debt) it risks a seizure.
As this debt expansion comes to a halt (or reverses) the Norwegian economy will shrivel, despite the continued high petroleum related activities and production.

Takk Rune
Som alltid er det en fornøyelse å lese din blogg. Dette er den beste beskrivelsen av gjeldssituasjonen, og i hvilket stadium Norge er som jeg har lest. Når det smeller for Norge sin del avhenger jo stort sett bare av oljepris, men som du tidligere har beskrevet er vil vel antall oljefelt i drift nå sitt maksimum i løpet av neste år. Da er det ikke bare produksjonen som faller, men også etterspørselen etter alle servicekomponenter vedrørerende offshorevirksomheten. Selvsagt kan man benytte seg av oljefondet som en ekstra doping i noen år, men om man ser på pensjonsforpliktelsene litt fra i horisonten har man jo allerede “brukt opp” oljefondet. Jeg tror det smeller om 2 til 5 år, men nedturen har allerede startet.
Mvh
Jan Erik Pedersen
Siv-øk NHH (90-kullet)
LikeLike
Jan Erik,
Takk for tilbakemelding.
Jeg betrakter petroleumsøkonomien som en del av realøkonomien. Om oljeprisen skulle falle noe tilbake, venter ikke jeg noen store konsekvenser de nærmeste årene for aktivitetsnivået i petroleumssektoren. Felt som ikke lenger er drivverdige vil etter hvert bli stengt ned uten at dette har omfattende virkninger på sysselsettingen.
Gjeldsveksten, spesielt hos husholdningene (som nå har en gjeldsgrad et sted mellom 200 – 210 % av disponibel inntekt og er en av verdens høyeste; i USA var denne 130 % når boblen brast!) blir fulgt tett da denne har en stor effekt på norsk økonomi. Denne delen av økonomien er hva jeg betrakter som en del av den finansielle økonomien, dvs den virtuelle.
Virtuelle systemer er langt mer responsive for endringer, noe som vises i figurene 3 og 4 i innlegget. Husholdningenes gjeldsvekst utgjør også en stor komponent av det offentliges inntektsside. Endringer her vil derfor ha raskere og mer omfattende effekt på blant annet sysselsetting. Jeg holder det for sannsynlig at de som nå (og de som tidligere) bemanner regjeringskontorene er oppmerksomme på dette.
Om effekten fra endringer i husholdningenes gjeldsvekst er godt forstått så vil dette nå kunne skape tilbakeholdenhet med hensyn til løfter om skatte/avgifts lettelser.
Dette handler like mye om persepsjon (psykologi) som om reelle begrensninger og dersom det kommer et stemningsskifte så vil dette kunne være selvforsterkende og få langtrekkende konsekvenser.
Det å spå om når et sånt skifte kommer er den vanskelige biten og det at det er lenge siden vi har erfart harde begrensninger kan ha gjort folk selvtilfredse/likegyldige noe som kan forsterke reaksjonene når det kommer mer tydelige tegn på at farten i økonomien er i ferd med å avta.
Rune
LikeLike
A CLOSER LOOK INTO THE DRIVERS OF THE NORWEGIAN ECONOMY’s RECENT GROWTH SUCCESS | FRACTIONAL FLOW [url=http://www.kingstonhospital.nhs.uk/linkss.php?module=list&brand=mulberry-sale&page=1]mulberry sale[/url] mulberry sale
LikeLike
Thank you for another excellent analysis. The state of the Norwegian economy has quite a lot of implications here in iceland. After the economic crash 2008 the boom in Norway gave us a lifeline in some ways. People out of work could quite easily get well payed jobs there and many companies have been able to expand their business to Norway.
I have a couple of questions:
Presently Norway is producing a similer amount of liquids and gas in energy terms, but do you have an idea how the net revenue for the government from the oil and gas sector is diveded between the two, is oil the dominating factor?
In light of falling oil production and rising costs for new projects, how fast might the government revenue from the oil and gas sector fall in the next few years, assuming prices stay reasonbly stable? More than 10% per year?
It would also be very interesting if you had any thoughts for the prospects in the Jan Mayen area. There have of course been issued exploration licenses for the Icelandic side of the area and there is quite a bit of excitement about it here and some big numbers have been thrown out. That optimism seems to come mainly from a Norwegian character, Terje Hagevang.
LikeLike
Hello,
Iceland has been through some drastic remedies following the collapse of its banking sector and from what I have read, is now recovering albeit from a lower base and there are still challenges ahead.
When it comes to how liquids and gas is counted; I count NGL (Natural Gas Liquids) as natural gas, even if it is common to count it as liquids. Under atmospheric conditions most NGL’s are in a gaseous state. Further NGLs have a volumetric heating value (energy content) that is 60 – 70% of crude oil, which also is reflected in the prices NGLs fetch.
The estimate for government revenues for 2013 (based on a total government take of profits from 78% total taxation (effective tax rate of 70% to make approximate adjustments for write downs and uplift), direct government ownership managed by Petoro and presently 67% share in Statoil is:
From oil (which include condensates):..190 BNOK
from NGL and natural gas around:……150 BNOK
TOTAL:………………300 – 350 BNOK
All from an estimated gross of 600 BNOK. (BNOK; Billion NOK)
DECLINE IN GOVERNMENT TAKE
Towards 2020, I now expect an average annual decline in the area of 3 – 4% in total petroleum production from Norway. This includes Johan Sverdrup now scheduled to start up late 2019. However there will be a shift towards relatively more gas, thus gross income (all things remaining equal) could decline to an estimated 450 BNOK.
As new developments require a higher breakeven price and costs should be expected to remain fairly constant (adjusted for fields shut down as they reach the end of their economic life and general inflation), it could be that government take by 2020 is somewhere around 60% (roughly 200 BNOK) of 2013 levels (or close to a 7% average annual decline).
The government take is unabridged transferred to the Norwegian wealth fund (GPFG), exceptions (so far) has been the government’s portion of dividends from Statoil.
ARCTIC AREAS
What follows are my thoughts and observations.
The Arctic areas are challenging both due to environmental considerations and harsh weather conditions. Operations far from the mainland stretches the supply chains for goods and services and thus increases costs, and the Arctic is further away from the markets. The Arctic is thus also very much about logistics. Now there is good reason to believe that Arctic developments will require that future consumers have the abilities to pay the high price required making Arctic developments profitable.
Another consideration is companies’ financial capacities to take on any major Arctic developments in the near future. Many companies now have a big debt overhang that will restrain them for the next decade or so from undertaking major capital intensive developments, also in the Arctic.
When it comes to the potential for petroleum discoveries in the Jan Mayen area I tend to calibrate my expectations towards what the authorities/experts represented by the Norwegian Petroleum Directorate (NPD) estimates [I am not a geologist]. New provinces often require an exploration/drilling phase which yields new understandings about the potential and provides material for development of new exploration models.
Mother Nature has proven to hold surprises in both directions.
LikeLike
Hi, great analysis. I think we are about to witness a deleveraging process of houseehold debt here in Norway, with large implications for the economy. However as we see from the ‘theatre’ of this being played elsewhere, then we can assume a reduction of the reserve bank interest rates in Norway due to its deflationary tendancies. This may prove a blessing for Norway given that the US and likely UK as well as other developed countries start to reverse QE and increase rates, ceterius paribus causing a reduction in the NOK exchange rate. As wage costs are particularly high in Norway, especially in the oil sector, this will likely improve the bottom line for many companies, do tiu have any idea how much of a factor this is for operating costs? Also this will help improve competetiveness in the non oil exporting sector as well as increase the value of the sovereign wealth fund given its composition. Of course this will make imports more expensive but as food/agriculture is tied to norwegian costs/wages it may not lead to inflationary pressures…..any thoughts on this? Cheers, Mike
LikeLike
Hello and thanks!
The central banks act to lower interest rates may have several objectives. One of them could be to entice households to continue to take on more debt. However if households have reached debt carrying capacities, this will very much be like pushing on a string.
If and when Norwegian households starts deleveraging this by definition will be deflationary.
If and when Norwegian households start to (net) reduce their debts now around 160 Billion NOK annually will be taken out of aggregate demand and whatever metric is used to describe it, it will become huge and have a major impact on the Norwegian economy. When households in US reached their debt carrying capacities back in 2006/2007 it was the public sector that continued to go deeper into debt to keep the economy going. Norway has in relative terms relatively low sovereign debt, but for the public to fully replace for the decrease in private demand (from household deleveraging) could prove to a challenging call.
A lowered interest rate will likely help exports (exclusive of petroleum) as it both reduces debt service for industries and also weakens the currency. This is a kind of “beggar thy neighbor” policy and works as long other countries keep their rates. This may not be a given.
When it comes to the countries reducing their QE, US being the most important one as the US Dollar also serves as the world reserve currency, it appears as the judges are still out on this one with regard to future sizes for the monthly debt monetizing.
QE suppresses the market’s abilities to set interest rates. How long QE can be used for this is an open question, but higher interest rates for all parties will have a strong deflationary component. QE is also about fighting this deflationary force and an effort to create some inflation and thus what is referred to as economic growth.
A weakening of the Norwegian Krone will increase the market value (as expressed in NOK) of the sovereign wealth fund, but has no effect on its international value.
It is possible to both have inflation and deflation at the same time. Inflation in goods/products that is needed and deflation in mostly everything else.
Rune
LikeLike