This post which is based on results from earlier research and analytic work posted on The Oil Drum, Fractional Flow and not least in recent (private) discussions with other international acknowledged experts present some facts and observations about developments of tight oil (which to some extent also applies to oil sands) versus small deep water discoveries*.
*Small deep water discoveries are here meant discoveries with Estimated Ultimate Recovery (EUR) below 100 Million Barrels of Oil Equivalents (MBOE).
![Figure 1: Chart above shows relative developments in annualized yield curves (lh scale) of oil for so-called elephants (Norwegian deep water discoveries estimated to hold ultimate recoverable reserves (EUR) above 1,000 million barrels with crude oil [red lines]). Small discoveries (Norwegian deep water discoveries estimated to hold ultimate recoverable reserves (EUR) below 100 million barrels with crude oil, [green lines]). The reference tight oil well for Bakken [violet lines]. The cumulative versus time is plotted against the rh scale. Note also the short high flow life cycles of small deep water developments and tight oil.](https://runelikvern.com/wp-content/uploads/2020/05/e4f80-relative-yield-curves-elephants-small-deepwater-and-tight-oil.png)
Small discoveries (Norwegian deep water discoveries estimated to hold ultimate recoverable reserves (EUR) below 100 million barrels with crude oil, [green lines]).
The reference tight oil well for Bakken [violet lines].
The cumulative versus time is plotted against the rh scale.
Note also the short high flow life cycles of small deep water developments and tight oil.
A tight oil well recovers its oil (EUR) at a relatively slower rate than a small deep water development. This does not tell the full story as the realities now facing the companies like their size, risk appetites, the composition of their portfolios, capital structure and financial situation may be decisive at how they employ their available capital.
Once tight oil acreage is held by production the company is free to develop it at its own pace and respond to market conditions and available cash.
Big International Oil Companies (IOC’s) are from their capital structure used to long and capital intensive lead times. The scale makes a material difference and IOC’s expect large revenue and net cash flows against their technical manpower commitments, reflecting the need to cover a lot of overhead.
- Companies that both hold prolific tight oil acreage (thus the acreage acquisition is sunk cost) in North America (Bakken, Eagle Ford and others) and have deep water discoveries in their portfolios, will now, and using point forward approaches, give priority to tight oil wells (and oil sands) due to predictability and scalability (staged investments, CAPEX flexibility).
- Small, deep water developments have proven to be associated with high reservoir risks and high capital commitments.
- From the start of the investment until it is grossly recovered it takes normally 3 – 4 years for a small Norwegian deep water discovery, if it produces as expected.
- For the Bakken reference tight oil well it takes around 2 years from the well is spudded until the investment is grossly recovered.
Taxation, royalties, OPerational EXpenses (OPEX), debt services, general and administration etc. will extend the actual recovery periods of the investments. - Companies are CAPital EXpenditure (CAPEX) constrained and will favor the developments of sources with the least associated risk that simultaneously offers good returns and capital flexibility.
- Companies and their CEO’s, like Statoil’s Lund (links to text in Norwegian, try Google translate), now states that their focus will shift from barrels to profitability. Recent developments of several of the small Norwegian deep water discoveries prove to yield substantially below what was expected when these were sanctioned. The effects from this is (at best) increased break even costs and extended recovery periods (ignoring taxation effects) for the employed capital.
Typically the development of a small deep water discovery in Norway costs around $800 – $1,000 Million and normally takes a couple of years from being sanctioned until it starts to flow.
A tight oil well in Bakken now costs around $9 Million and from spudding until it flows it normally takes 4 – 6 months.
At a realized oil price of $90/Bbl the Internal Rate of Return (IRR) on a point forward basis was estimated at around 22%. (Which is good!)
Estimates do not include costs for debt services and income from natural gas/NGPL sales which now averages a gross of $3/Bbl. Entrance costs (acquisition costs for acreage and/or companies) are NOT included in the estimates presented in the chart above.
Estimates shown are NOT full cycle break even costs.
By including the acquisition costs the full cycle break even price moves higher. For a company holding acreage (acquisition costs will be considered sunk costs) thus the manufacturing of additional wells can be considered on a point forward basis (partial cycle).
Companies that both hold tight oil acreage and have small deep water discoveries in their portfolios will find that these developments are in competition with each other for CAPEX. The developments that show the greatest prospects for returns, best predictability and offers investments scaling (employment of capital) is likely to see most of the companies’ CAPEX flow their way. This consideration is now believed to weigh more heavily in the near term as many companies will find their future CAPEX under pressure, also from targeting financial performance.
NOTE: For some companies (IOC’s) that acquired their tight oil acreage in Bakken/Eagle Ford through acquisitions of other companies, forecasts now for the full cycle profitability (return) are slightly negative.
Rigzone recently touched on this issue in this article.
The main take away from this post is that new global oil supplies increasingly come from more expensive (as in technically demanding), short cycle, rapidly declining sources and that there are considerable risks associated with some of these sources. Several oil companies are now struggling with growing their supplies (barrels), high debt overhang, declining profitability and cash flows.
At the other end a growing number of consumers find it harder to afford the higher prices required by the oil companies to develop oil supplies from more exotic and distant sources.
The oil companies apparently are also confronted with an insurmountable task of getting this message across to all affected.
What has been presented in this post raises some interesting questions/observations:
- Small, deep water developments and tight oil are now major sources to offset declines from heavily depleted legacy fields and provide any growth in global oil supplies. Common for these two sources are that they have steep decline rates.
- Tight oil appears now to be the last frontier to be tapped into and has in recent years seen improved understandings, enhanced extraction technologies, offers good predictability and CAPEX flexibility. However tight oil can not become a global long term supply solution and may at best be viewed as a temporary bridge.
- Developments of small deep water discoveries now appear to come with more associated risks than tight oil.
- The portfolio of conventional oil resources (providing low cost oil) appears to have been exhausted leaving to the exploitation of more expensive and exotic sources.
What credible and sustainable oil sources will there be after tight oil (and oil sands)?
Any Arctic sources for supplies is still decades into the future, are expensive and logistical demanding (market access).
Both small, deep water developments and tight oil have short high flow life cycles, very steep decline rates which makes it harder and harder to create growth in global oil supplies (The Red Queen effect).
High (and increasing) CAPEX towards tight oil developments and recent year’s dismal results (with a few exceptions) from exploration for conventional sources may thus lend credence to Art Berman’s reference to the tight oil phenomenon as a “retirement party”.

Rune,
Great work as always. Are the oilsands at all comparable to the high flow short productive life cycle of tight oil and small deep water discoveries? Is this a difference between the growing share of in-situ projects vs. mining?
LikeLike
Paul, thanks!
What oil companies increasingly are focusing on is return on capital (investment). Oil sands do not initially offer the high flow per invested $$ as tight oil (or small deep water discoveries), but more a long plateau (until the area is depleted).
What oil sands do offer is better predictability (of returns) and scalability despite being capital intensive and requiring longer time to recover the investment. The beauty of tight oil is that the investment (on a point forward basis) normally is recovered in a couple of years.
My bet now would be that if tight oil and oil sands were competing for CAPEX (within the same company) tight oil would be preferred.
How oil sands would compete versus small deep water discoveries that I believe is a question not only about capital, but also risk appetite.
This is a very dynamic world.
LikeLike
Hi Rune,
I often use your methods to attempt to determine breakeven oil prices. I your recent post you have done breakeven calculations using $4/ barrel for OPEX, $9 million for well cost, royalties and taxes at 24.5 % of wellhead revenue and transport costs of $12/ barrel. Earlier you had an “other cost” (which I believe was primarily financial costs) of $3/ barrel in determining the breakeven price. I notice that you note that sales from natural gas and NGL amounts to $3/ barrel, so I am assuming that because these two (financial costs and NG and NGLrevenue) offset each other, that the “other costs” have been dropped.
Am I understanding this correctly? Thanks.
Dennis Coyne
LikeLike
Actually upon further reading I may be mistaken about the debt service (maybe $3/barrel) and NG and NGL revenue offsetting because we would need the net revenue on the NG/NGL sales to offset the debt service.
Do you have any idea what the net revenue is for the NG/NGL per barrel of oil produced would $2/barrel be a reasonable estimate? If so I would think adding a dollar of “other costs” to the calculation of breakeven would make sense. I agree that leaving out the land acquisition costs makes sense, but I think accounting for the debt servicing in the breakeven calculations makes sense.
Thanks.
Dennis Coyne
LikeLike
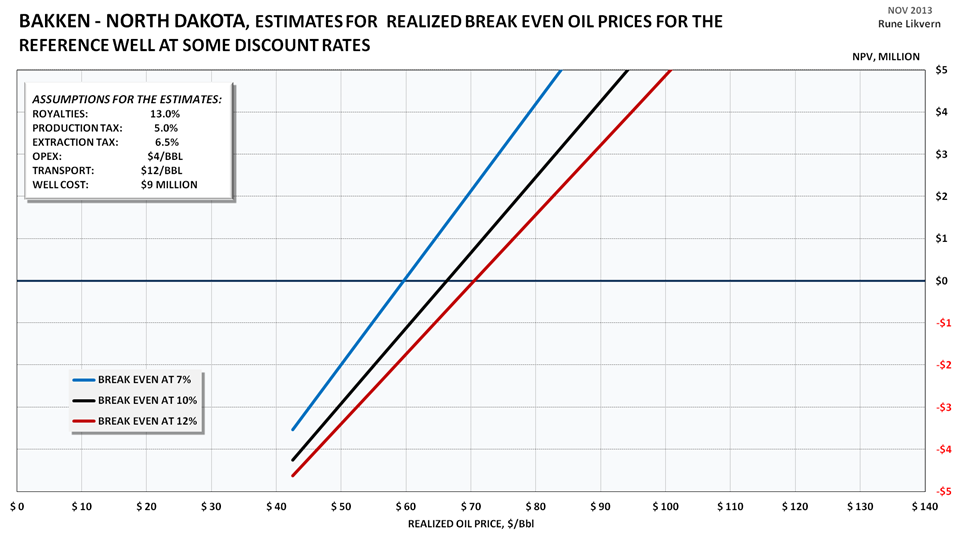
A final question. Rockman often suggests that the oil companies are looking to payback the cost of the well over a relatively short time frame such as 3 or 5 years. I the past you have used longer time frames such as 20 years for your NPV, would it make sense to shorten this to maybe 10 or even 5 years, because the tail of your average well profile is pretty fat, this might make a difference in your breakeven prices. I have been using 5 years myself, but I was curious how many years are included in your figure 2 above.
DC
LikeLike
During 2013 estimates now suggests that in aggregate there is less use of debt for additional wells in Bakken. The use of debt may vary amongst companies and also the time frames used to retire them. The approach I have suggested is to assume that the use of equity also has a cost.
With regard to NG/NGL and how much it nets is an interesting one, and also dependent upon how costs from the production (from each individual well) is allocated. If NG/NGL was singled out to estimate their net contribution, I presently suspect the net to be very low and for some wells even negative, which may make flaring of NG (from Bakken) with present NG prices look economic attractive.
The above is also stated in the text accompanying the chart showing NPV estimates.
What I suspect Rockman (Rockman should be capable to elaborate further on what he refers to) is referring to is the timeframe (3 – 5 years) companies are looking at for nominally recovering their investment.
NPV is discounting the net cash flow over the expected economic life time. For the chart in my post an economic life time of 30 years was used.
What would be the rationale to shorten the life time for NPV estimates?
The tail of my reference well may or may not be too fat. As of now there is little actual data from a significant number of wells with which to say how developments in well flow are 6+ years out in time. As actual data becomes available one simply adjusts the well profile for the reference well (or well in question) accordingly.
Discounting effects and the decline in production, as from year 6+, will however have small effects on the breakeven price. Flow (apart from the oil price) from tight oil wells during the first 5 years has a dominant effect on the NPV and thus the breakeven price.
LikeLike
Hi Rune,
I should have used the term “financial costs” (whether debt or equity or a mix). In the past I believe you included financial cost and other costs of about $3/barrel in your breakeven calculations. Have you dropped these because these “financial costs” have dropped for the average producer so that they are able to fund their capital expenditures without any debt or equity financing?
Dennis
LikeLike
Hello DC,
For the chart in this post financial costs/debt services were not included (stated with the chart) as for now (2013) I have not dug further into specific company data to have a more detailed look about portion of debts used for additional wells (it may be 30%, it may be none). In more detailed analyses I would have allocated debt services on a specific basis ($$/bbl). In other words the estimates shows the marginal added well.
My primary objective with the chart above was to show estimates on a “point forward” basis assuming a company had acquired (paid for acreage) and now used (primarily) net cash flows to finance additional wells.
Main objective was to show break even price on a “point forward” basis for a well added now and at the same time informing what was/was not included, in other words use the data from the chart with some error bars applied.
If a portfolio of wells/company and with different time boundaries was evaluated and presented I would have included financial costs, also on a specific basis ($$/bbl).
LikeLike
Actually I was just trying to understand the change from your earlier break even analysis where you suggested the “other costs” (which you suggested were primarily financial costs) were about $3/barrel.
In this case there were no “other costs” (as is clearly shown on your figure 2), but you mention below the chart that gross revenue from NG/NGL sales was $3/barrel. I thought perhaps you thought these two (NG revenue and financial costs) cancelled each other. Perhaps I still am missing something.
I also realize that it is the gross NG revenue and not the net revenue that matters in this case. This is because the costs of the operations are borne by the C+C revenue and the NG/NGL revenue is just extra income that can be used to offset financial costs. So from that perspective your current breakeven analysis makes perfect sense to me now.
No doubt this may have been so obvious to you that it was not worth pointing out. I thank you for your patience. I would appreciate it if you point out any major points that I am understanding incorrectly.
Also just for another perspective, Rockman claims that the annual discount rates that he sees in NPV calculations range from 10 to 15 %, so in the future you might try 10, 12.5, and 15 rather than 8, 10, 12 for discount rates.
Dennis Coyne
LikeLike