The goal for any commercial company is to make as high as possible profit and returns on invested (employed) capital, primarily the owners’ capital, equity.
Light Tight Oil (LTO) extraction from the Bakken and Three Forks formations in North Dakota had a new high of 1,17 Mbo/d in Apr-18 according to data published in Jun-18 by the North Dakota Industrial Commission (NDIC).
This article is an update of this (which has more details on specific costs to which there are small changes) and is a small expansion focused on profitability/financial metrics.
- Scenarios were run there no wells were added as of Jan-19 (in the Bakken, Three Forks formations) with an initial flow above 1,2 Mbo/d to get estimates on NPV (DCF) and returns for the project and on equity (owners’ capital), ROE and ROI with a sustained oil price of $60/bo and what oil price would provide the project with a 7% return (ref table 1).
All at the wellhead (WH).
These runs had cut off end 2040.
The objectives with such scenario analysis is to establish baselines from which it becomes possible to follow developments in several financial metrics, also adjusted for oil price movements.
Applied to companies, it provides for benchmarking of companies’ management performances. - At $60/bo (and $2,50/Mcf for natural gas) the Bakken project would return about 4%.
- A 7% return was obtained with a sustained oil price of $73/bo (and $3,00/Mcf).
- The above estimates do not include costs for acreage, 800 Drilled UnCompleted (DUC) wells with an estimated total cost (employed capital) of $2,0B – $2,4B, any refracking (ref Marathon), flared gas and future costs for Plugging & Abandonment (P&A) for about 12 000 wells started as of Jan-09 to end 2018, estimated at a total cost of $1,8B – $2,4B and recognized write downs.
- Including the items described above, the estimates show a full cycle return of 7% for the Bakken as one big LTO project would be achieved at a sustained future oil price at about $80/bo [$90/bo WTI].
- One of the best and most reliable metrics for investors are NPV projections for Equity (Owners’ Capital).
A NPV projection for equity that comes in at about 0 with a discount rate of 10% (the higher the better) is considered acceptable (reference also tables 1-5).
This metric allows comparisions across sectors. - A run was done to estimate the effects from pushing back the time from where no wells were added with 5 years (from 2019 to 2024) while remaining close to cash flow neutral (all other things kept equal). This reduces the return for both the project and equity (owners’ capital).
The discounted return on equity (owners’ capital) was lowered from 14% to 10% with $73/bo at WH.
Alternatively a higher oil price is required to achieve some targeted return. - By applying financial leverage in the extractive industries, like oil extraction, it allows to extract the reserves faster (accelerate the depletion). In the Bakken the use of high financial leverage explains the rapid buildup in extraction levels.
In this article financial leverage expresses the ratio of debt [inorganic funding] to equity [owners’ capital] used in a company’s investment.
When financial leverage works, it boosts return (acts as a multiplier) on owners’ capital.
If it does not work (what many companies painfully discovered after the oil price collapsed in 2014), leverage works fast in the opposite direction and destroys owners’ capital.- From companies’ SEC reports it was found that there is a huge span in their financial performances in the Bakken, one major big oil company has lost all their equity of $4+Billion [in the Bakken], one was found to have big negative retained earnings (accumulated deficit) of $2+Billion and then there are several companies on trajectories towards varying degrees of profitability.
- The 3 years, 2015-2017 with the oil price under $50/bo left primarily the wells of the 2014 – 2016 vintages (ref also figure 2), suffering from the low oil price, and it is now projected these vintages could incur total losses (write downs) of $6B – $8B with a sustained oil price of $60/bo.
These losses are and/or will be recognized on the companies balance sheets (equity, reduced owners’ capital) as the wells end their economic life and are Plugged & Abandoned (P&A).- Older vintages and future wells could fully or partially make up (cover) for these losses from their profits at a sustained oil price of $60/bo. A lasting oil price above $60/bo speeds the healing.
Irrespective of a future higher oil price and how this probable loss is handled by the oil companies, the 2014 – 2016 vintages will for many years provide strong headwinds to the profitability for many companies in the Bakken.
This is one of the many things that is hard (close to impossible) to identify from the companies’ SEC filings.
- Older vintages and future wells could fully or partially make up (cover) for these losses from their profits at a sustained oil price of $60/bo. A lasting oil price above $60/bo speeds the healing.
This post includes some estimates with some profitability metrics for the average 2017 vintage well for 2 price scenarios and how a company with solid finances and strong discipline can boost discounted return on equity.
This also illustrates why project NPVs, undiscounted cash flows, time to pay outs, ROE and ROI may be poor metrics when analyzing and ranking several projects and/or companies.
Short story, several metrics should be estimated and compared to get the best possible information about the prospects for financial profitability for any project/company.

NOTE; the chart in figure 1 shows an estimate (red area) on the development of total capital employed (equity and borrowed) (as from Jan-09 to Apr-18) that first needs to be recovered before profits can be made.
The payouts were reached late 2022 at $60/bo and late 2021 at $73/bo.
The chart does not give any indication about future profits or losses.
The section “A little on Assumptions, Concepts and Terms used in this Article” at the end of this article may be helpful to explain most of the assumptions applied and terms and acronyms appearing in it.
Caution should be exercised to generally project results presented in this article on companies.
For public companies the best insights are derived from their SEC filings, researching the actual performances of their well population and apply some alternative proven metrics derived from actual data.
The rapid build in the Bakken LTO extraction between Jan-09 and Dec-12 was a result from outspending cash flows from operations with an estimated $20B. A major portion of these $20B was debt. This massive debt infusion together with a lasting, high oil price had a strong reinforcing effect that boosted production and cash flows from operations.
This is the magic of financial leverage.
The high oil price (about $100/bo [WTI]) during 2011 – 2014 resulted primarily from a boost in world credit/debt creation post the global financial crisis in 2008. This was accomplished through concerted efforts by the worlds biggest central banks with the objective to bring the global economy back on its growth trajectory. China and the US led this credit expansion which took place as the oil market was in a tight supply/demand balance.
Data from the Bank for International Settlements (BIS) show that 43 countries constituting 90% of the world’s Gross Domestic Product (GDP) injected a total of about $35 Trillion (US$ market value) from mid 2009 to mid 2014. This support for the high oil price provided the signal for a period of massive leveraged investments by the oil companies to develop new oil supply capacities and temporarily provided consumers some tolerance for a higher oil price.
This was described in this article published in Jun-16, refer its figures 4 and 5.
Starting in 2014 world oil supply overtook world demand and collapsed the oil price. The debt fuelled strong growth in US LTO extraction played a major part in this.
The second period of interest is from the oil price collapsed in 2014, and until the oil price again went above $50/bo (at WH), during which the companies in the Bakken outspent cash flow from operations with an estimated total of $10B – $12B in a bet that the low oil price was transitory.
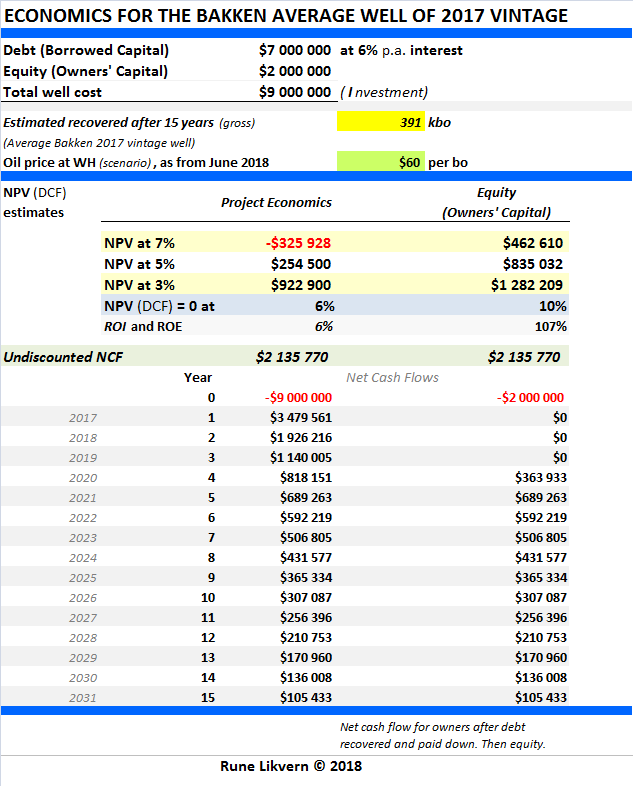
For the estimates shown in table 1 it was assumed that the Bakken leverage was 3:1 (out of an estimated total $36B in employed capital, $27B is debt and $9B is equity) at end 2018. This leverage is much in line with what was found from the companies’ recent SEC filings.
Note how the estimate of total companies’ equity of $9B (at end 2018) compares to probable losses, now at $6B-$8B for the 2014-2016 vintages.
Positive Net Cash Flow (NCF, Net Cash Flows from operations) is NOT necessarily profits.
Simplistic explained, the NCF for a company has 3 components which portions vary with time;
1) Debt recovered
2) Owners’ capital (Equity) recovered
3) Profits
For a company with 100’s or 1 000’s of wells its management cannot identify this split (debt/equity/profit) over time without accounting tools there each well is defined as a profit/loss center during its economic life. This accounting tool allows management to make better projections and efficiently allocate capital.
For Q2-18 a company in the Bakken could produce and present for the investors a snapshot that shows NCF split into say 70% debt recovered, 20% equity recovered and 10% profits recovered (from older vintages and wells that has passed payout).
The debt portion is “untouchable”, equity (or portion of it) may be returned to shareholders/owners via dividends or reinvested, profits may be used for dividends (or a portion of it and the remaining to increase retained earnings, which builds equity [owners’ capital] which over time may allow to sell more debt for more well manufacturing).
An early identification of probable write-downs allows management to address it head on by planning and executing a stealth deleveraging (or other measures) to absorb such a blow.
Stealth deleveraging diverts funds from CAPEX and dividends.
The 2014 – 2016 vintages could place many companies in a pickle 10 – 15 years down the road. With a sustained oil price at $60/bo they are facing huge write downs that could wipe out portions or all of their equity.
(At $100/bo this becomes an inconvenience.)
Considerable write downs could breach covenants and cause the (senior) creditors demand to have a word in the management of the company.
The SEC reports presents financial data on aggregated levels, so it is close to impossible for investors to break out financial data by the vintage of wells or split the NCF into debt/equity/profit.
It is such things described above together with NPV projections [on equity, owners capital] that will define future CAPEX in the Bakken and its extraction levels.

Including costs for acreage, DUCs, refracking and P&A lowers the presented (discounted) returns.
Expanding the analysis to 2008 also lowers the discounted returns.
Sophisticated major investors are aware of this (they have the resources to run the numbers), and companies that continue to push back dividend payouts could cause sophisticated investors to become more active during companies’ conference calls, general assemblies or otherwise in lobbying for dividend payouts as soon as possible.
Sophisticated investors use a baseline targeted return (which could be rebased from swings in the oil price) to evaluate how efficient the companies’ management deploys owners’ and borrowed capital.
Update on the average 2014, 2015 and 2016 Vintage wells in the Bakken

A well started in Dec-14 would be on a similar trajectory towards pay out as the 2015 average started in Jan-2015.
As the well depletes and flow declines its specific cost increases, making the full recovery of the investment (and its EUR) increasingly dependent on the oil price.
The wells that are on trajectories not to reach payout by the end of their economic life, (this could still be 10 – 20 years away) will recognize their losses after P&A by write downs which reduces the owners’ equity.
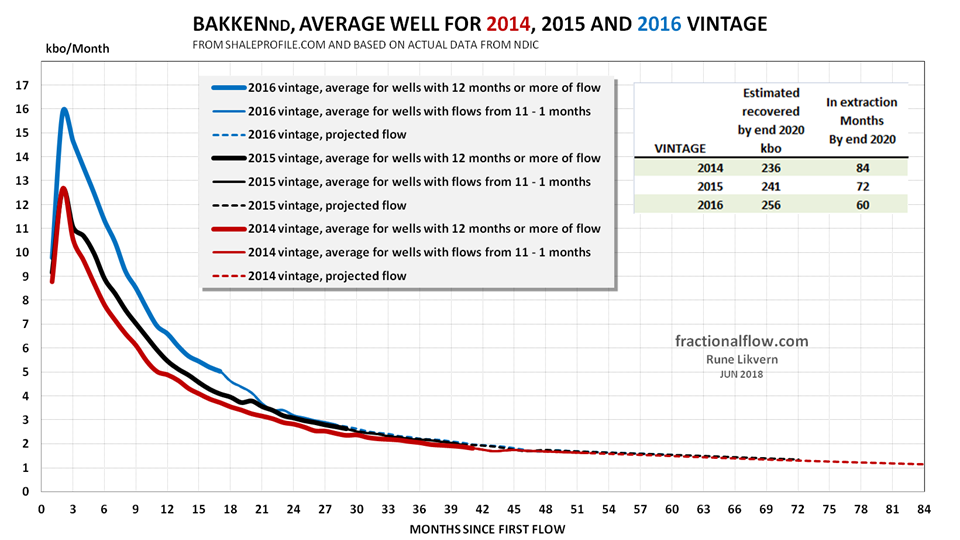
Figure 3 shows there have been improvements of cumulative recovered oil (shown by the lifted flow curves) versus time for the younger vintages. These improvements have continued for the 2017 and 2018 vintages and it will take years to get high confidence estimates on the EURs for these wells.
Longer laterals, more proppants, more water and more fracking stages and thus costlier wells have allowed to pull oil extraction forward in time. It is hard from using actual production data from NDIC to derive anything about the quality of the rocks (geology) for the younger well vintages. For this it would be helpful to also have specific data like bo/d/100ft, bo/d/frack stage or other relevant metric.
The oil price realized will continue to be the dominant factor determining LTO well profitabilities, then the quality of the acreage (geology) followed by technological improvements (human ingenuity).
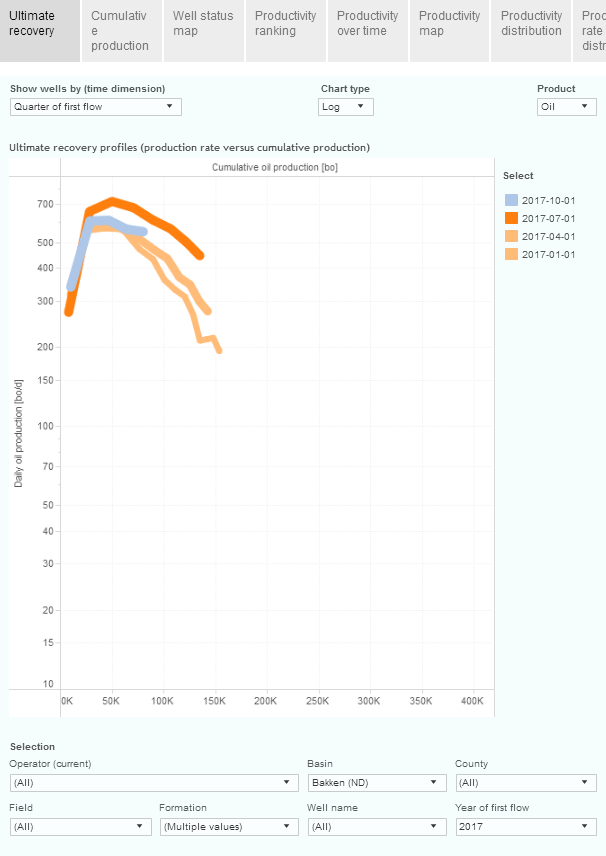
The readers are encouraged to follow the developments at shaleprofile.com which allows the users for interactive design of multiple charts to be presented (and downloaded) based on a wide range of users specified technical parameters, which are computed from actual data from state authorities, on developments in the major US oil and natural gas shale plays. Developments have been/is updated monthly as official data are published.
At shaleprofile.com the readers can themselves observe that flow from the 2015 – 2017 vintages now approach the older vintages after about 30 months from start up.
The operator/owner of the well is not concerned about the return on borrowed external capital (debt). This is covered through regular interest payments (coupons). The lenders are focused on getting their debt fully redeemed at the agreed date and the interest payments.
The operator/owner is focused on NPV return on the owners’ capital (equity).
As the well produces, it is assumed (as a simplification here) that borrowed capital is first recovered from NCF and paid back in full. Then equity is recovered in full which happens at payout and from there the net cash flow of the remaining part of the economic life for the well (adjusted for P&A costs) is the owners’ profits.
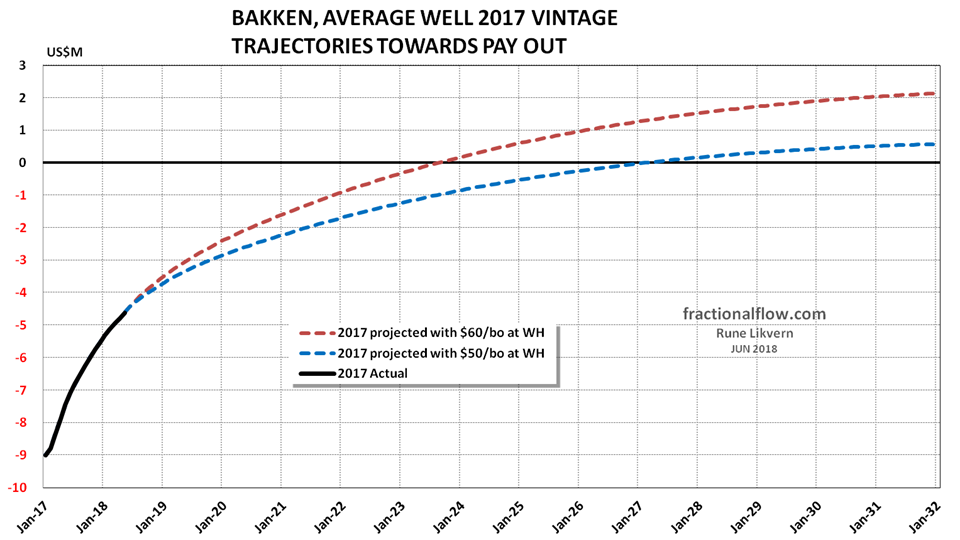
Figure 5 illustrates that full pay out for the well is pushed back about 3 years if the future oil price is $50/bo instead of $60/bo. As debt ($7M) is recovered first, note how the price affects the recovery of equity ($2M) and profits. In the example in figure 5 return on equity becomes about 3% with $50/bo (refer also table 2 below).
The company could start returning equity to the owners after the debt is recovered and while the well is on a trajectory towards full recovery of the investment, payout. Profits are the net cash flow after payout adjusted for P&A.
The payout trajectories for the 2017 vintage are affected by the oil price for the month it starts. An average well started in Dec-17 will show a faster recovery (less time to pay out) than one started in Jan-17.

At $50/bo the presented metrics show that the investment is highly marginal and the projected return from the well is comparable to putting the equity into so-called risk free papers, like US 10 Year Treasury (US10YT).
In the real world (and to keep it simplistic) a company/owner would operate with two sets of financial reports from where it followed the profitability of the same project. One is for simple project economics (left side of the tables) and the other one for equity performance (right side of the tables). As shown, this results in some different insights into the same project, and management would focus on the right side as they are compensated to create as much value as possible for the owners (shareholders).
For the scenario in table 3 the return on equity was estimated at above 10%.
For the presented estimates in table 2 and 3 it was assumed that first debt is recovered (normal for most companies) and paid back (with interest), then equity at no interest. This is the reality for most companies operating in the Bakken. In the covenants with creditors, there are several agreed upon financial metrics by which the senior creditors ensures they will recover their money. The creditors monitors these until agreed interest payments are received and their debt is redeemed.
XT Scenario for the Bakken average Well of 2017 Vintage
XT is here a derivative from eXTreme and intended to illustrate that undiscounted NCF, estimated time for payout, NPV for project economics, ROE and ROI may be deceptive and incomplete metrics to evaluate how good a project/well is.
A company exists to optimize owner/shareholder value/return on their equity. I am in the camp that favors that use of equity (owner/shareholder capital) also shall be assigned an interest for the amount that is employed at any time. The rationale for this is that capital has a cost and owners’ capital should be no exception.
One of the best and most reliable metrics is NPV (DCF) projections on equity (owners’ capital).
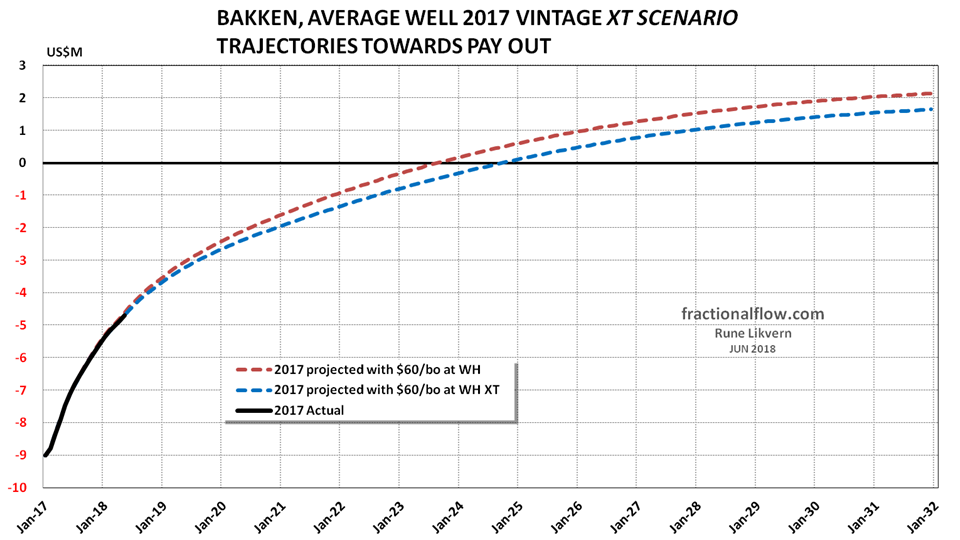
The chart above leaves the impression that the normal case is preferable to the XT case as it faster reaches payout and have higher profits at end 2031. As it is return on equity that matters, this changes when NPV estimates are run and the results from these are summarized in tables 4 and 5 below.

The scenario XT is applicable to a big integrated oil company/corporation, in which the Money Department stitches together a funding package for the project (well) for the E&P department, and assigns an interest to equity borrowed to the E&P department, who handles the project execution and operations. This interest would normally be something above risk free investments, like US 10 Year Treasuries (US10YT) now at about 3%, and the volume weighted average for its borrowed capital which depends on its credit rating.
In the examples this is not included and such interest income from the “borrowed” equity is subject to taxation.
Adding interest to the equity in the scenario presented in table 4 will improve NPV return on equity by about 1% (in the example shown from 17% to 18%), but lower undiscounted NCF, ROI and ROE and push back the time for payout.
The benefit from this is that the equity ($2M in the example) is fully recovered in about 6 months after start up of the project/well, and may, as it is recovered, be used together with additional debt to fund another project (well). The same equity could thus be used to fund 2 wells in less than a year (assuming a manufacturing time of 4 – 6 months for a well). This $2M equity could thus allow for 2 wells within 1 year, which in total improves the undiscounted profits from the equity, despite each well having a lower undiscounted profit and ROE and ROI than the normal case.
As with everything else there are limits to how far this concept can be stretched and the company’s risk analysts provides current projections and advises management.
This concept works for a company/corporation with healthy finances and an organization with the required skill sets.
It also requires realistic projections at a high confidence interval (like 95%) on the future flow of the project/well.
The oil price represents the biggest uncertainty in oil extraction and big oil companies apply a well researched conservative future price trajectory for their investment decisions. Big oil companies are aware of the effects of price swings and know that the futures fluctuates.
This illustrates that also in LTO extraction size matters as a big corporation have more flexibility and can increase returns or tolerate a somewhat lower oil price to achieve some targeted return.

Despite most of the presented metrics are favorable for the normal case, the return on equity (owners’ capital) is far better in the XT case and those with the flexibility and financial clout would go for this.
Return on equity (owners’ capital) is what both management and investors focuses on.
Some on Assumptions, Concepts and Terms used in this Article
Operational data on developments for G&A, interest costs (specific financial costs), LOE, transport have been derived from companies’ SEC filings and are volume weighted averages of several companies primarily exposed to the Bakken.
- On developments on Gas Oil Ratio (GOR) and water cut, data from shaleprofile.com has been used. Shaleprofile.com lists what their sources for the data are.
More on developments on specific well costs here.
EUR; Estimated Ultimate Recovery, the amount of oil and gas that is estimated/expected to be economically recovered (field, reservoir and in the shales, a well).
Equity is a generic term and in this article is meant shareholders/owners’ capital that have been or planned employed to earn a profit/return.
Equity for owners/shareholders is meant to be the total capital raised from Initial Public Offerings (IPO), retained earnings, proceeds from assets/equity sales, cash etc deployed and/or available for the development of the company.
Owners’ equity is one of the most important inputs for metrics used by creditors in processing loan applications or in evaluations of purchasing companies’ debt and from which loan covenants are designed.
Flaring; For all the presented estimates, NO adjustments for flared gas.
GOR; Gas to Oil Ratio, ratio of associated gas produced with each barrel of oil, expressed as Mcf/Bo.
Hedges, effects from hedges are not included in any of the estimates presented. Hedges can work both ways.
Interest rate; Unless otherwise stated an interest rate of 6%p.a. was applied. This was derived as a volume weighted average from several companies’ 10-K/Qs.
There is now an upward trend for the interest rate, refer also the Federal Reseves Bank (FRB) funds rate and LIBOR (London Inter Bank Offered Rate). As of writing and based on companies’ SEC filing it was found that the effective interest rate for these has moved upwards.
Leverage; Ratio of debt to equity [Owners’ Capital]
- Leverage is an efficient way to boost return on equity (owners’ capital) when conditions are favorable. If the projections (oil price, well flow) turns sour, leverage fast destroys equity. Developments in the companies’ equity [retained earnings] are closely monitored by creditors and investors.
- For the Bakken(ND) as one big project a fixed leverage of 3:1 was applied from 2009 through 2018.
NCF = Net Cash Flows (for a specified period)
NPV = Net Present Value [Discounted Cash Flows (DCF)]. Estimates here shown for Investment and Equity [Owners’ Capital].
- NPV is the full cycle net cash flows discounted at a specified rate over a projects lifetime and gives a projection of a project’s profitability. A discount rate of 7% for projects is now a good first iteration to help range several projects. Projects that do not meet this first hurdle is normally not worth pursuing at the time of the estimate.
The next iteration is to have a look at NPV for equity (post tax) and normally owners here will use a higher discount rate. This helps narrow down the alternatives of projects where equity and debt will be allocated. The Net Present Value (NPV) estimates are cut off as Net Cash Flow (NCF) become negative.
Oil price used (unless otherwise specified) is North Dakota Sweet (NDS, used as price at the wellhead [WH]). The average spread between WTI and NDS has been above $10/bo in the recent 2 years.
For natural gas, a price of $2,50/Mcf at $60/bo and $3,00/Mcf at $73/bo were used.
P&A, Plugging and Abandonment (Data provided on recent wells P&Aed show these to be $150k – $200k/well.)
Retained earnings; are the total of the profits, proceeds from assets/equity sales, share capital that a company has employed at any date and becomes adjusted for any dividends or other distributions paid to investors. This is a positive number which changes whenever there is an entry in the accounting records.
- Negative Retained Earnings are in finance lingo named “Accumulated Deficit”.
ROE (Return On Equity) = Net Income/Equity [Owners’ Capital]
ROI (Return On Investment) = Net Income/Investment
Royalties; Royalties of 18% has been used unless otherwise specified.
SEC; US Securities and Exchange Commission
Taxes; According to current tax rates, in Bakken a total of 10,5%.
“Tax Rebate”; For accrued interest costs, these were reduced by 35% through 2017. From 2018 this was reduced to 21%.
Well costs were found from several companies’ SEC filings to be in the range of $8,4M – $12,4 M/well for 2017.
- Each well is defined as a profit/loss center.
- The average well for the population of a specified vintage is used to describe how the whole population of the specified vintage will fare. A more granular model uses data for the average well by month for all vintages.
(Not presented in this article.) - A normal distribution of the wells for any vintage provides a good map of the distribution of projected profits and losses for the whole well population.
Write down, the analysis for the Bakken is not adjusted for recognized write downs irrespective of what processes caused these.
The financial performance amongst the companies operating in the Bakken has shown and will continue to show a wide spread.

You must be logged in to post a comment.