In this post I present some of my observations and thoughts about the developments in the oil price, supply and demand, exchange rates (relative to the US dollar), petroleum stocks and what near term factors are likely to influence the oil price.
- The price of oil (and other commodities) appears to have been influenced by the central banks’ policies post the GFC of 2008 (Global Financial Crisis, primarily the Fed as the US dollar is the world’s major reserve currency) with low interest rates which allowed for growth in total global credit/debt.
- As the Fed confirmed its end of QE3 (QE; Quantitative Easing) program by the fall of 2014, the oil price started to decline. This decline became amplified by an oversupply resulting from years of debt fueled high capital expenditures by the oil companies to develop supplies of costlier oil for the market to meet expectations of growth in consumption.
- With the end of QE3 the US dollar rapidly appreciated versus most other major currencies, which offset some of the decline in the oil price in most economies (oil is priced in US dollar), the exceptions being the US and China (which has its currency pegged to the US dollar).
- Demand and consumption of oil (actual data so far only for the US) responded to the price collapse by some growth. However the world’s growth has not been sufficient to close the gap between supplies and consumption, thus sustaining a downward pressure on the oil price.
- The oil price collapse motivated oil companies with low variable costs (OPEX) to compensate some of the loss of cash flow by increasing their production (volumes), thus creating a dynamic where growing supplies went looking for demand.
- The oil price collapse and a period with a favorable contango spread incentivized a strong build in stocks and as stocks remain at elevated levels, it may take some time before stocks return to “normal” levels.
![Figure 1: The chart above shows the developments in the oil price [Brent spot, black line. The red line is the smoothed one year moving average] and the time of central banks’ announcements/deployments of available monetary tools to support the global financial markets which the economy relies heavily upon. The financial system is virtual and thus highly responsive. NOTE: The chart suggests some causation between FED policies and movements to the oil price. The US dollar is the world’s major reserve currency and most currencies are joined to it at the hip.](https://runelikvern.com/wp-content/uploads/2020/05/33b80-fig-1-the-oil-price-and-fed-tools-aug-15.png)
NOTE: The chart suggests some causation between FED policies and movements to the oil price. The US dollar is the world’s major reserve currency and most currencies are joined to it at the hip.
- As growth in global credit/debt slows, comes to halt or deleveraging sets in, this will affect demand and prices, also for oil.
Relative developments in some Exchange Rates and the Oil Price
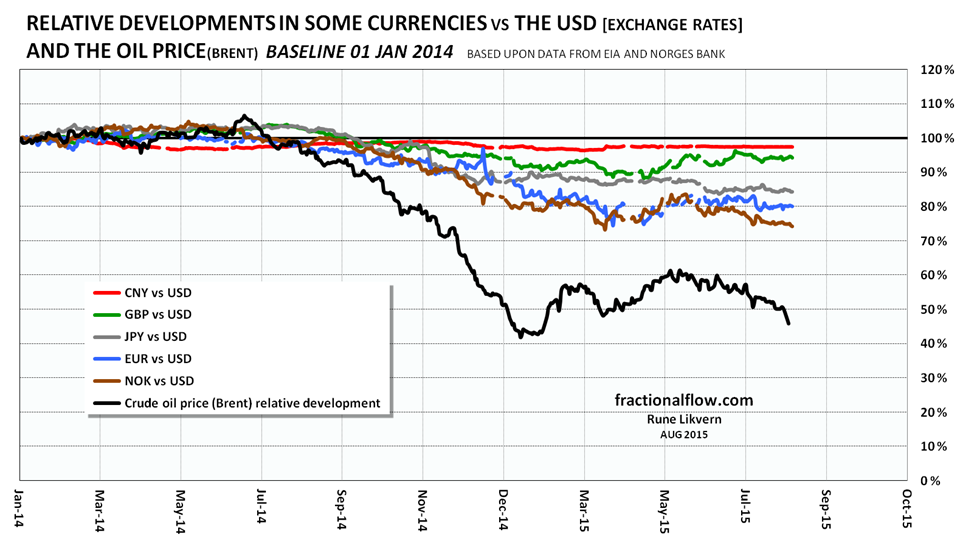
As the Fed tapered and concluded QE3 in the fall of 2014 other currencies started to depreciate versus the US dollar. Exception is the Chinese one that is pegged to the US dollar. The depreciation of other currencies versus the US dollar caused an impairment of the purchasing power for consumers outside the US.
The oil price has declined faster/deeper than the currencies depreciated thus making oil cheaper/more affordable in most countries.
For most oil producers and exporters outside of the US the depreciation of their currencies (relative to the US dollar) has lowered their cash costs (OPEX as described in US dollar) leaving an incentive to maintain or even increase production to somewhat compensate for the decline in price with increased volumes.
For oil trades settled in US dollar a lower oil price means less revenues in US dollar for the exporters, thus less US dollars available for these to spend.
US Petroleum Stock levels

US commercial crude oil stocks started to grow as the oil price collapsed and levels remain unusually high, suggesting lower need to replenish during the fall season.
Supplies above consumption will be looking for a place to be stored. Developments in stock levels beyond the “normal” range serves as a proxy of the supply/demand balance. With a sustained oversupply inventories at some point will reach a level which it becomes challenging to move beyond. Suppliers may respond to such a situation by accepting a lower price.
OECD relative Developments in Petroleum Consumption
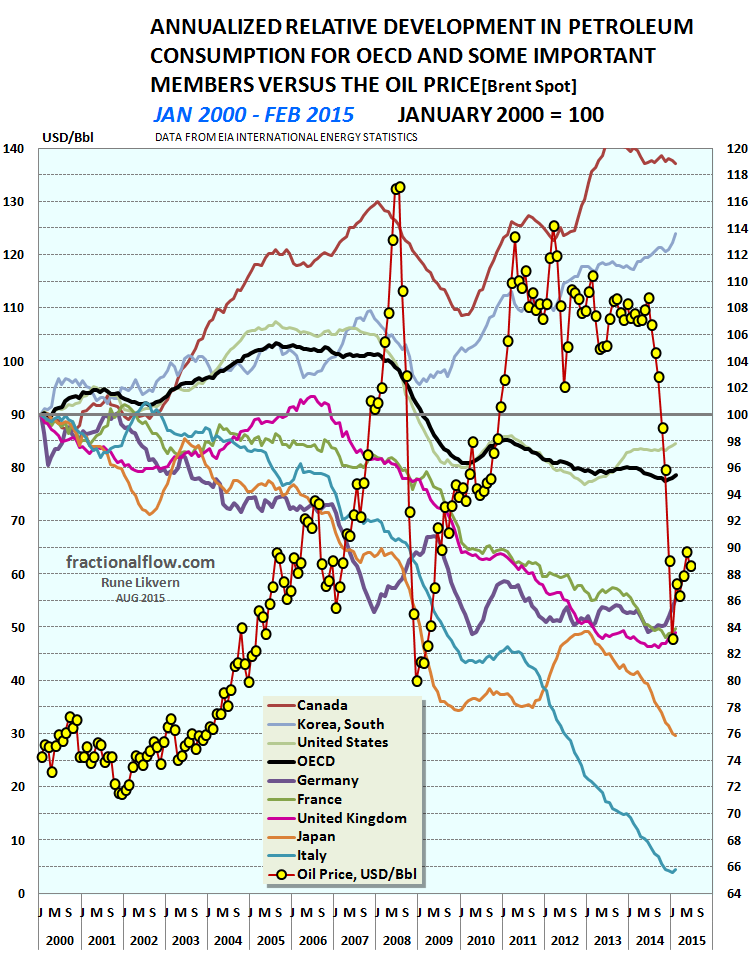
Note that Italy is down about 34% since 2002, Japan is down 24% since 2000, while Canada, a net exporter of oil and gas, saw a growth of around 20% since 2000.
Note the right hand y-axis is not zero scaled.
The growth in OECD petroleum consumption during the first half of the previous decade coincided with a period of strong credit growth, which also allowed for some tolerance for a higher oil price.
The high oil price of 2008 coincided with a private sector that had run out of space on their balance sheets for more credit/debt whereby sovereigns took over and increased their deficit spending. Synchronously several central banks acted in concert and deployed several monetary tools. At the same time China started an aggressive credit expansion pulling other emerging economies with it. All this to bring the global economy back to the previous growth trajectory.
This resulted in renewed support for growth in oil consumption and support for the oil price.
Total petroleum consumption for all OECD for Jan-Feb 2015 versus the same period of 2014 is up 0,84 Mb/d (1.8%) and the US is up 0.36 Mb/d (1.9%), likely driven by the decline in the oil price.
This time there are lots of things that are different from 1986, 1998 and 2008.
The most important is the significant growth in total global debt since 2008. Encouraged from what appeared as a sustainable higher oil price the oil companies used the increased assets/equity valuations as collateral to go deeper into debt to develop costlier supplies. All projections from those that matters (EIA, IEA and the major oil companies) showed expectations of growth in demand and consumption which would support a high oil price.
The oil companies thus entered into a bet that consumers would find more room on their balance sheets to take on more credit/debt which would support and sustain a high oil price.
Global Oil Supplies and Demand
![Figure 5: The chart above shows developments in world supplies of crude oil and condensates from January 1994 to March 2015. The chart also shows possible conceptual trajectories to supply potential and demand [all right hand scale]. The oil price [Brent spot] is plotted against the left hand scale.](https://runelikvern.com/wp-content/uploads/2020/05/8b30f-fig-5-world-crude-oil-and-condensates-supplies-aug-15.png)
The oil price [Brent spot] is plotted against the left hand scale.
Oil companies are now massively deferring investments in new supplies from a combination of reasons, primarily due to profitability outlooks and impaired financial capabilities from revenue contractions caused by the low oil price. This will at some point in time make it harder to offset depletion induced declines from the vintage(r) sources and will reduce the global oil supply potential.
Our societies are reliant on financially healthy oil companies. The recent oil price collapse impairs their balance sheets and should the price go higher in the near future, the oil companies still need more time to strengthen their balance sheets and gain reassurance that the higher price will be sustained before they in a meaningful way start to invest in the costlier to extract oil.
Our complex societies run on oil and are therefore dependent on financially healthy oil companies as these are the experts to explore for, develop, extract and bring to the market the oil our societies run on.
The dynamic created from growth in total global debt, which in some respects reflect how consumers’ obtained temporarily affordability for higher priced oil, will at some point in time have to face up to reality. This reality will manifest from consumers experiencing reduced access to credit/debt. This will affect the demand for and the price of oil.
The situation now has no precedent, therefore understanding the real drivers [future access to credit is one important one] of demand trajectories is imperative to understand probable future trajectories for the oil price. There is no way to rule out that the oil price will remain low for an extended period, resulting in an erosion of the world’s supply potential while demand remains lower.
A sustained low oil price while the supply potential declines and demand stays lower may easily support a false narrative. Many observers may point to the low oil price as proof that a declining supply is not worrisome.
Our societies run on energy surplus (NOT money!, our (virtual) financial systems are very much like the operating systems of a PC, tablet, smart phone etc, all of which does not function without energy).
A decline in the supply potential of our most important, non renewable energy source will also be a signal about our prospects to maintain our built complex infrastructures.
- The BIG UNKNOWNs going forward are; how will global DEMAND for oil and consumers’ AFFORDABILITY for higher priced oil develop.
Earlier I presented an analysis of oil demand and global debt in the post Changes to Total Global Credit Affects The Oil Price.
The analysis linked to looked at the relations between changes to total credit/debt and petroleum consumption for some big economies covering the years 2001 – 2013 based on data from BIS (Bank for International Settlements) and BP (British Petroleum).

Have you looked at my resent post, http://ourfiniteworld.com/2015/08/10/how-economic-growth-fails/
I think that this tells part of the story as well. The world’s economic “growth pump” is pumping slower and slower. This holds down wages of non-elite workers and demand for commodities, including oil.
LikeLike
Hi Gail, and nice post.
This ”economic pump” was primed by growing amounts of (private) credit/debt. At some point the economic productivity of added credit/debt starts to decline and if total debt levels are above some threshold it may even go negative. Reason is all added credit goes to service the total debt load.
GDP and wages also became inflated from the growth in credit/debt. As the growth in credit/debt slows, comes to a halt or deleveraging sets in, GDP and wages will become affected in a negative way.
This is where I believe we are now. Ref the decline in (average) disposable income for households which shrinks their balance sheets and thus makes it harder to get access to more credit.
Money (the virtual financial system) allocates energy flows within societies.
Credit acts as money and adds to aggregate demand. This is a cause and effect thing.
Credit comes first [demand can be paid for] which allowed to grow energy consumption (use leverage) which grew GDP and wages.
IMO the mismatch, we see between the financial system and energy, is what amongst others Nate Hagens refers to as “THE REAL TRADE”.
The energy density of fossil fuels substitutes for great amounts of manual labor, which is the real trade.
The financial system does not recognize energy for what it really is.
Credit/debt allowed for over collateralization, IMO we are now on the verge of a process where this becomes apparent.
LikeLike
Not much demand growth coming from Europe
Europe oil consumption peaked 2005
http://crudeoilpeak.info/europe-oil-consumption-peaked-2005
LikeLike
HelloRune, thanks for your post!
I wanted to ask what do you think about this comment from Dave Cohen:
You probably don’t know this, but years ago I was affiliated with the peak oil people. I wrote a weekly column for ASPO-USA for a couple of years, and attended (at least) 3 of their annual conferences. I started out at The Oil Drum (now defunct).
Well, the peak oil people were wrong, and I was wrong, though we might prefer the term “premature” because the oil supply will not rise forever.
As I came to grips with my error later, I realized I’d been barking up the wrong tree. As Jim said, the timing of these catastrophic events remains uncertain. If you try to forecast that kind of stuff, you will always be wrong unless you get lucky, which is very unlikely.
But I was barking up the wrong tree in a deeper sense too. I had underestimated human technological cleverness, which is a more profound error. In fact, I am still surprised that U.S. shale oil production is maintaining despite these falling oil prices. Shale operators were able to make big leaps in the efficiency of production, which is a remarkable achievement.
So in the end I was wrong about Human Nature. If you have read the Flatland essays or DOTE itself for some time now, you will notice that this blog is about how humans characteristically behave. It is not about making doomer predictions about this disaster or that one.
And of course when doomers do make those “doomed” predictions, they are simply illustrating the human nature I have described.
http://www.declineoftheempire.com/2015/08/a-global-minsky-moment-1.html
Best,
Alex
LikeLike
See also this recent news, where shale oil can be pro profitably exctraced even at 30 dolars per barrel.If true, if would significantly postpone peak oil, while worsen the climate change problem:
http://www.bloomberg.com/news/articles/2015-08-12/oil-at-30-is-no-problem-for-some-cost-cutting-bakken-drillers
—
LikeLike