In this post I present actual Norwegian natural gas production, status on reserves, the development in discoveries and what this results for my expectations for the future delivery potential for Norwegian natural gas.
Included is also a brief look at actual and forecast development for EU’s (+Norway) consumption and production of natural gas.
Norway is not a formal member of the European Union (EU).
This post is an update on my post back in March 2013 (in Norwegian).
Norway, after Russia, has been and is the EU’s second biggest supplier of natural gas. In Europe the outlook for natural gas supplies is followed with heightened interests following the recent developments in Ukraine and its ability to continue to afford Russian natural gas. A big portion of the natural gas consumed by EU transits from Russia through Ukraine.
The potential for any interruptions to EU’s natural gas supplies has made EU consult other suppliers requesting these to have a look at their potentials to increase deliveries to offset any shortfalls to natural gas deliveries from Russia.

My forecast (developed in the spring of 2014) and the forecast from the Norwegian Ministry of Petroleum and Energy (MPE) shows basically the same trends, but differs about the timing for the start of the decline and how steep it will become. My forecast results in some kind of plateau towards the end of this decade followed by a steep decline, refer also figure 4.
I now expect the Norwegian delivery potential for natural gas to decline by 40 – 50% by 2025.
Beyond 2025 Troll and Snøhvit (LNG) are likely to be the backbones of Norwegian natural gas supplies.
Norwegian natural gas deliveries had a high in 2012, were lower in 2013 and data as of July 2014 suggests it may become even lower in 2014, refer also figure 2.
I prefer to use the term delivery potential as buyers may choose to take less gas than contractual allowed for, dictated by swings in demand and the winter’s weather is a big moderator for gas demand. The Troll field is operated as a swing producer to take the brunt of swings to buyers’ demand.
Aasta Hansteen is scheduled to start flowing in Q4 2017 and would have its profitability improved by being the opener for other developments in the Norwegian Sea, like Fogelberg and Zidane (total EUR of 30 Gcm [Bcm]) which now has been postponed.
Recent Developments in Norwegian Natural Gas Production

Numbers are not adjusted for NGL extraction and volumes are on daily basis.
For the period January – July total Norwegian natural gas production is about 4% lower in 2014 relative to the same period of 2013. The chart illustrates how production from the Sleipner area declines as the reservoirs become depleted. During the winter months around 50% of total Norwegian gas deliveries comes from 2 discoveries, Ormen Lange and Troll.

The Forecast expressed by the R/P Ratio
The R/P (Reserves divided with Production) for a specified year, provides a snapshot for how many years the estimated reserves at the end of that specified year theoretically can be sustained.
The R/P snapshot also serves as a valuable test (as close to a verification the most recent data allows) on the realism of the forecast in figure 1.

The area for the boxes in figure 4 represents NPD’s estimates of estimated recoverable reserves (EUR). The height of the boxes represents the extraction level in 2013 and the length how many years this extraction level theoretically could be sustained.
With time the area of the boxes will shrink reflecting the depletion of the reservoirs, while the heights and lengths will change as the reservoirs deplete.
The R/P approach shows that for all practical matters NPD’s and my forecast (I refer to potential) towards 2018 are identical.
The chart illustrates that beyond 2018 there is a rapidly growing divergence between the IEA WEO 2012’s and my forecasts.
As of now the reserves and production data from NPD lends no support for IEA’s expectations for the level of Norwegian natural gas deliveries towards 2035.
Development and Status of Norwegian Natural Gas Reserves

The chart also includes a table that shows the year of discovery for fields estimated to hold more than 100 Giga cubic meters (Gcm = Bcm; Billion cubic meters) of recoverable natural gas.
The chart illustrates that the biggest discoveries were made early in the exploration phase and since the mid 1990’s more natural gas was produced than discovered. Many of the recent discoveries are relatively small, in deep water and requires thus a high gas price to become sanctioned for commercial development.
Split of Norwegian Natural Gas Sales between Continental Europe and the U.K.
Norway consumes a tiny fraction of its sales gas production and more than 99% is exported, primarily to Continental Europe and the U.K..
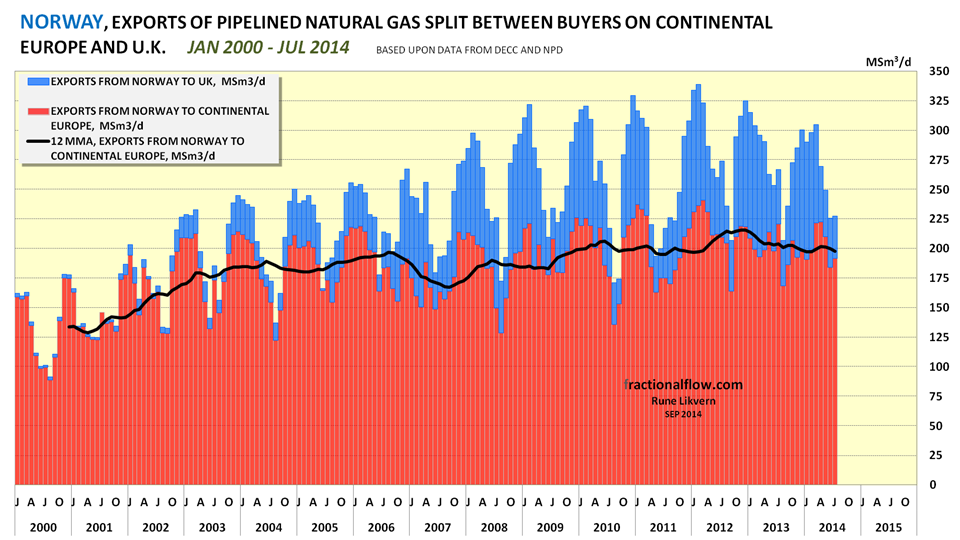
Volumes have been adjusted for estimates on NGL extraction, “shrinkage”.
Annualized deliveries to Continental Europe has in recent years been on some kind of plateau. The seasonal swings with Continental Europes buyer’s has apparently diminished in recent years, ref also figure 7 on how deliveries to the U.K. buyers show palpable seasonal swings in their imports of Norwegian natural gas.
The decline in Norwegian natural gas sales should also be seen in context with the dismal economic developments in several of the importing countries.

The chart reflects the U.K. imports, thus the use of the minus sign.
Europe and Natural Gas

Pipelined imports are primarily from Russia and North Africa (Algeria and Libya). In recent years LNG has mostly come from Qatar, Algeria and Nigeria.
The forecast for EU’s natural gas consumption towards 2025 (dotted black line) is from US Energy Information Administration’s World Energy Outlook 2013 (EIA WEO 2013).
- The EU’s natural gas consumption in 2013 was down around 12% relative to its high in 2005.
- The forecast shows that the EU will need to gradually grow its imports with an additional 120 – 150 Gcm/a relative to 2013 levels towards 2025 from more distant sources.
More distant and likely less reliant sources translates into more expensive natural gas.
What goes for oil also goes for natural gas, more expensive natural gas hinges on consumers’ ability to pay for it (affordability).
The EU has been and is struggling with the effects from total debt loads and as growth in total debt during the recent 3 decades allowed to grow consumption and pay for more expensive natural gas, the present deleveraging cycle diminishes these abilities.
..
“Walk with those seeking the truth, run from those who think they’ve found it.”
- Deepak Chopra
(Hat tip to Doug Leighton)

You must be logged in to post a comment.