This post is an update and slight expansion of my previous post In Bakken (ND) it is now mostly about McKenzie County about developments in light tight oil (LTO) extraction in the Bakken/Three Forks formations in North Dakota.
It also includes a little about developments in LTO extraction from Bakken/Three Forks in Elm Coulee, Montana.
Harsh winter weather affected additions of producing wells and also caused a total estimated 300 additional producing wells (relative to entering winter) to be shut in with different durations. The total effects from well additions that was below what was estimated to sustain a level production, and the high number of wells shut in caused total LTO extraction to move sideways last winter, with a small dip during December and January.
![Figure 01: The chart above shows development for annual tight oil extraction from the Bakken/Three Forks formations in North Dakota [green area and rh scale]. The black line shows development in the interest for the US 10 - Year Treasury [lh scale].](https://runelikvern.com/wp-content/uploads/2020/05/f37ee-fig-01-bakken-lto-and-10-year-treasury.png)
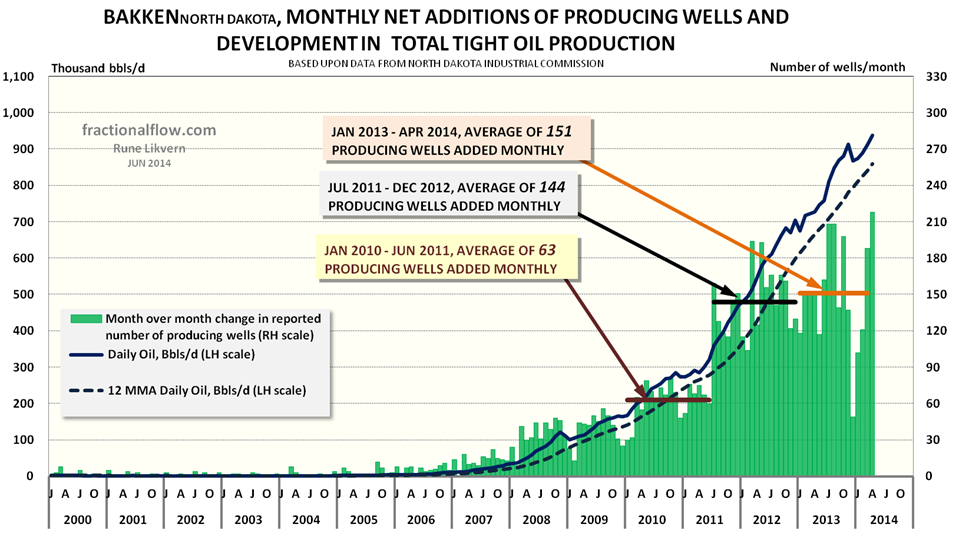
April 2014 had an average daily extraction rate of 937 kb/d LTO from the Bakken/Three Forks formations in North Dakota. Harsh winter weather caused the extraction to move sideways for some months.
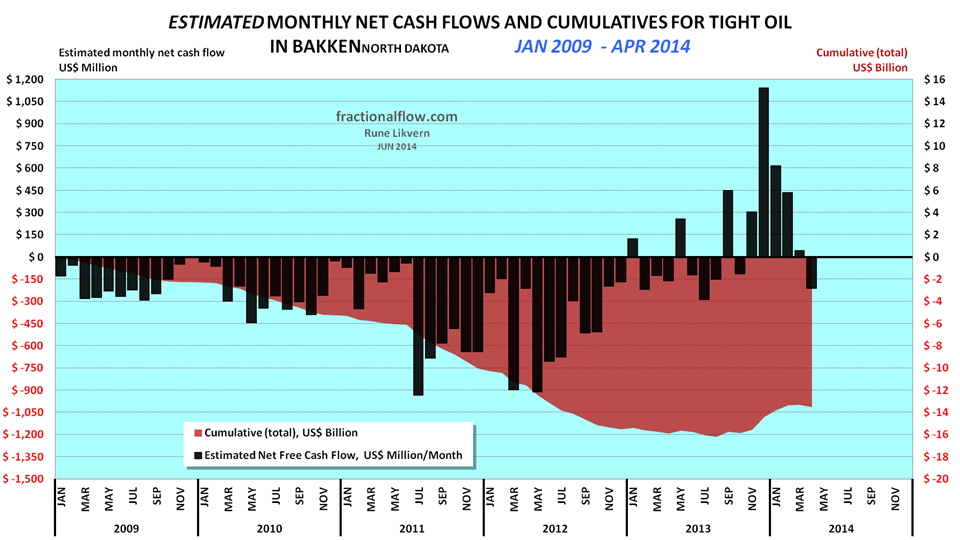
The assumptions for the chart are WTI oil price (realized price which is netted back to the wellhead), average well costs starting at $8 Million in January 2009 and growing to $10 Million as of January 2011 and $9 Million as of January 2013. All costs assumed to incur as the wells were reported starting to flow (this creates some backlog for cumulative costs as these are incurred continuously during the manufacturing of the wells) and the estimates do not include costs for non- flowing and dry wells, water disposal wells, exploration wells, seismic surveys, acreage acquisitions etc.
Economic assumptions; royalties of 15%, production tax of 5%, an extraction tax of 6.5%, OPEX at $4/Bbl, transport (from wellhead to refinery) $12/Bbl and interest of 5% on debt (before any corporate tax effects).
Estimates do not include the effects of hedging, dividend payouts, retained earnings and income from natural gas/NGPL sales (which now and on average grosses around $3/Bbl).
Estimates do not include investments in processing/transport facilities and externalities like road upkeep etc. The purpose with the estimates presented in the chart is to present an approximation of net cash flows and development of total use of debt.
The estimates suggest that during 2013 and so far in 2014 capital expenditures (CAPEX) for manufacturing wells may mostly have come (estimates do not adjust for dividend payouts) from the net cash flows from the growing population of producing wells. Use of debt appears to have slowed noticeably. These estimates are for all net added wells in the Bakken (ND) and there are differences between the oil companies.
The actual number of wells added any month may be higher than the net added derived from North Dakota Industrial Commission (NDIC) reported data, as some wells may have been permanently shut in and/or plugged and abandoned.
In 2014 an estimated $20 Billion will be used for manufacturing tight oil wells and construction of associated facilities in North Dakota.
THE 4 COUNTIES WITH THE BIGGEST OIL EXTRACTION
A closer look at developments in oil extraction from Dunn, McKenzie, Mountrail and Williams which are the 4 counties in North Dakota with the biggest oil extraction rates.
NDIC is now reporting oil extraction from 17 counties and the 4 counties with the biggest extraction rates having above 86% of the total oil extraction in North Dakota.
- As from 2008 and through 2012 Mountrail was the county that had the biggest portion of the extraction from Bakken (ND).
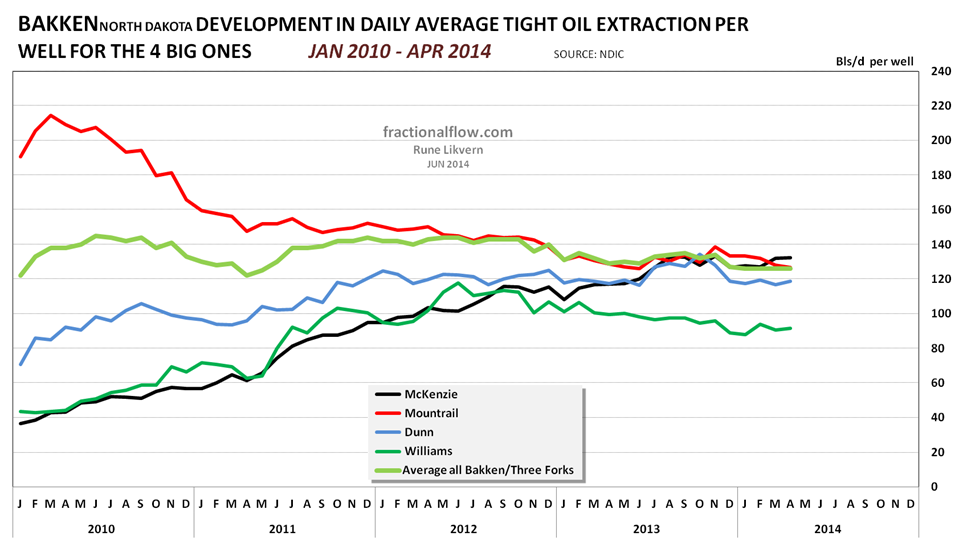
The county with the highest extraction rate is McKenzie, refer also figures 04 and 05. - McKenzie now drives the growth in oil extraction from the Bakken/Three forks formations, while the other counties show slower growth, refer also figures 05 and 06.
- Mountrail, with prolific fields/pools like Alger (refer also figure 11), Parshall (refer also figure 12), Reunion Bay, Sanish and Van Hook (refer also figures 09 and 10), shows a slow down in the extraction rate.
- McKenzie now provides for around 55% of the total annualized extraction growth from these 4 counties.
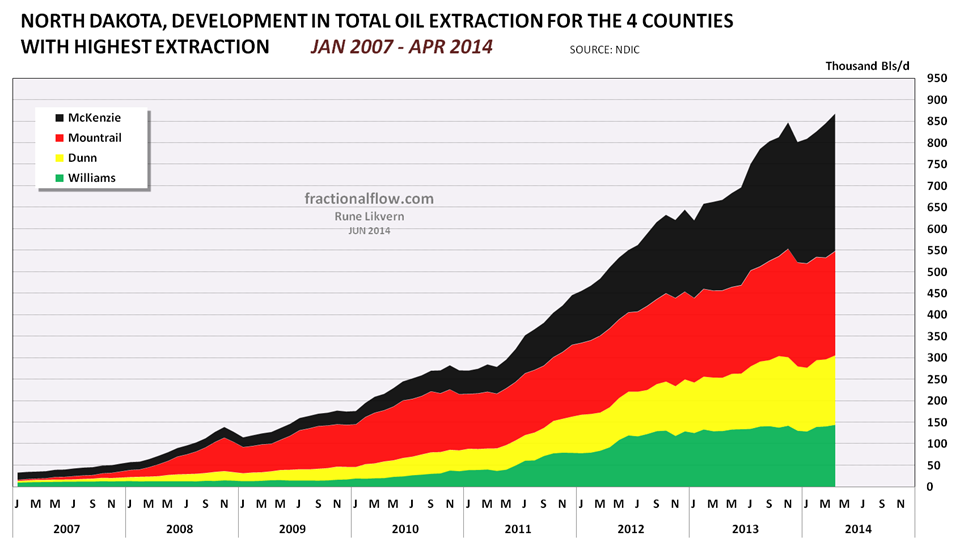
Presently growth in oil extraction from the 4 counties with the biggest extraction comes from McKenzie which in April 2014 had around 37% of the total extraction from these 4 counties.
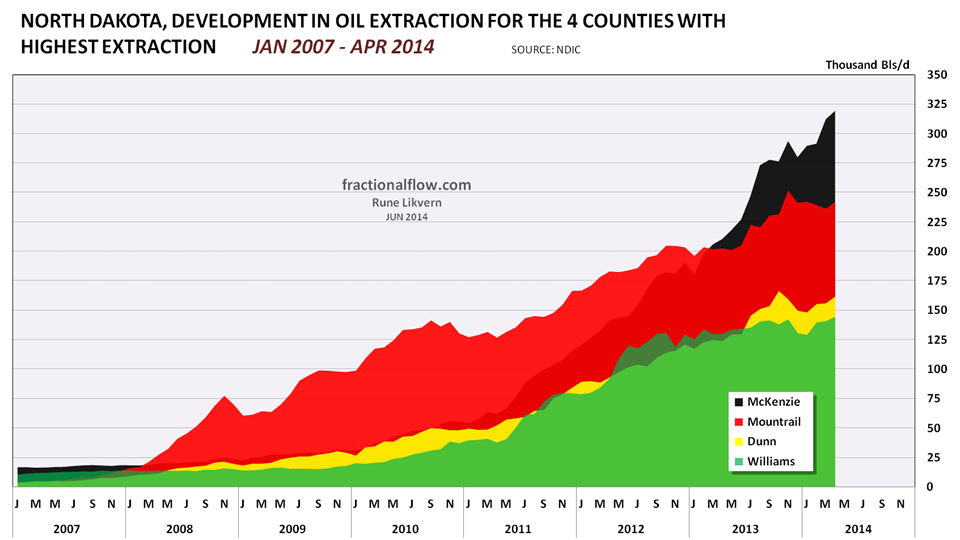
In the recent months, oil extraction in Dunn, Mountrail and Williams have moved sideways and growth has come from McKenzie. McKenzie has for some time had the highest number of net added producing wells (refer also figure 07).
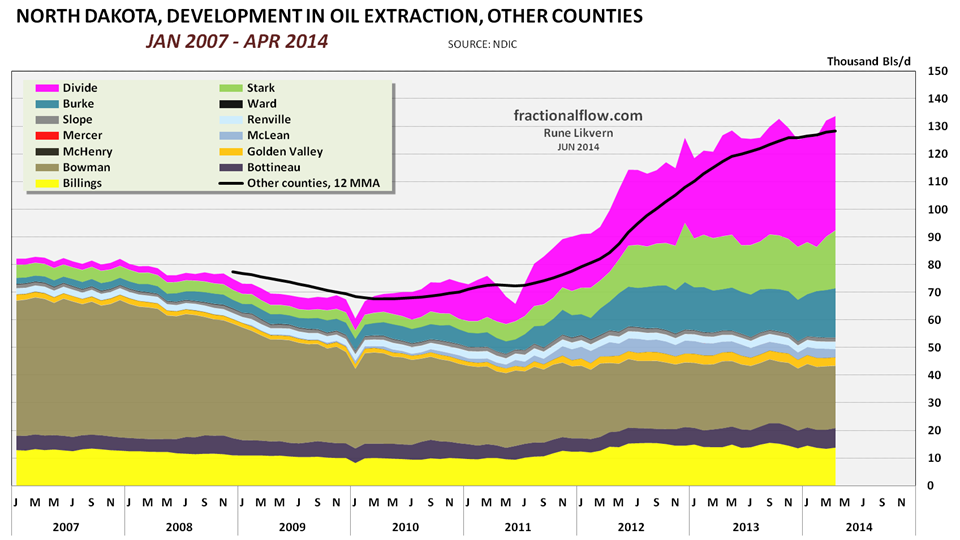
For the other counties in North Dakota, four counties; Billings, Burke, Divide and Stark saw growth in oil extraction starting back in 2010.
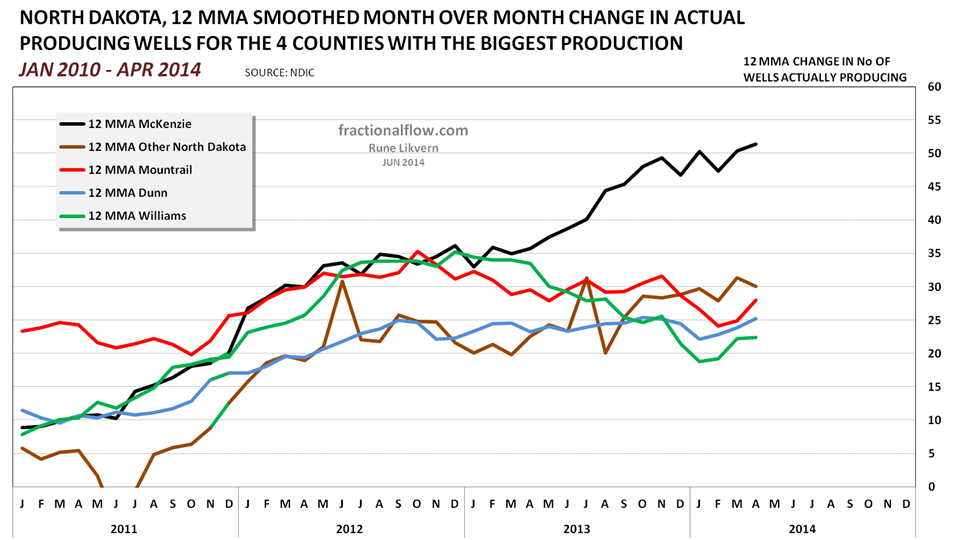
The net additions of wells in Williams have been on a downward trend, Mountrail and Dunn are more or less moving sideways, other North Dakota is in an upward trend and McKenzie showing good growth.
Growth in oil extraction comes from McKenzie (refer also figures 04 and 05) which on an annualized basis and as of April 2014 had more than 40% of net added wells for the 4 counties with the biggest oil extraction.
The chart above has been included for what it is worth.
IN MOUNTRAIL THE GROWTH IN LTO EXTRACTION COMES FROM THE “OLD” SWEET SPOTS
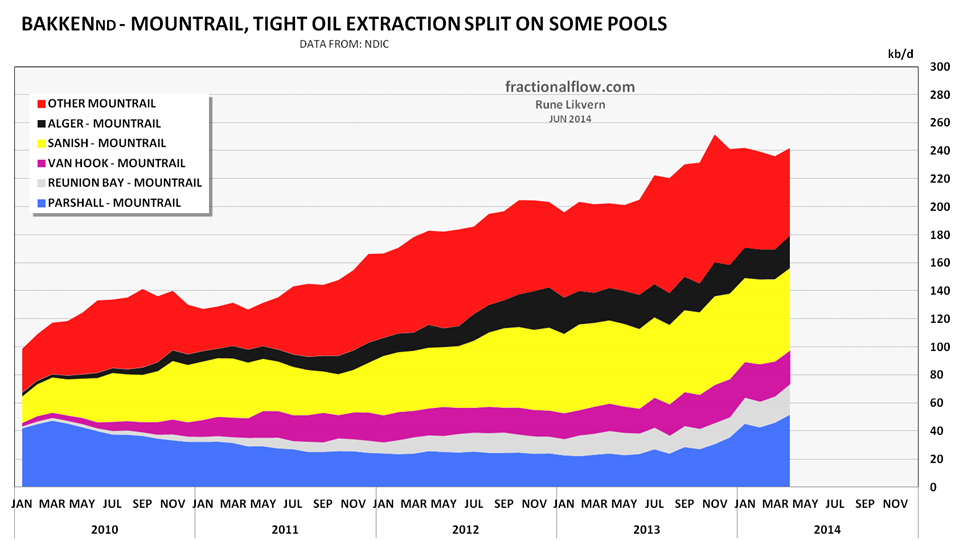
NOTE: The total oil extraction includes extraction from wells on confidential list. The extraction from the shown pools does not include extraction from wells on confidential list, thus actual extraction from these pools should be expected to be somewhat higher than shown in the chart
Extraction from other Mountrail should thus be expected to be corresponding lower.
Oil extraction rates in Mountrail are now sustained by renewed growth in extraction from the “old” sweet spots.
Mountrail was the county where the tight oil extraction rally got going back in 2007/2008 as the oil price was on a strong upward trajectory.
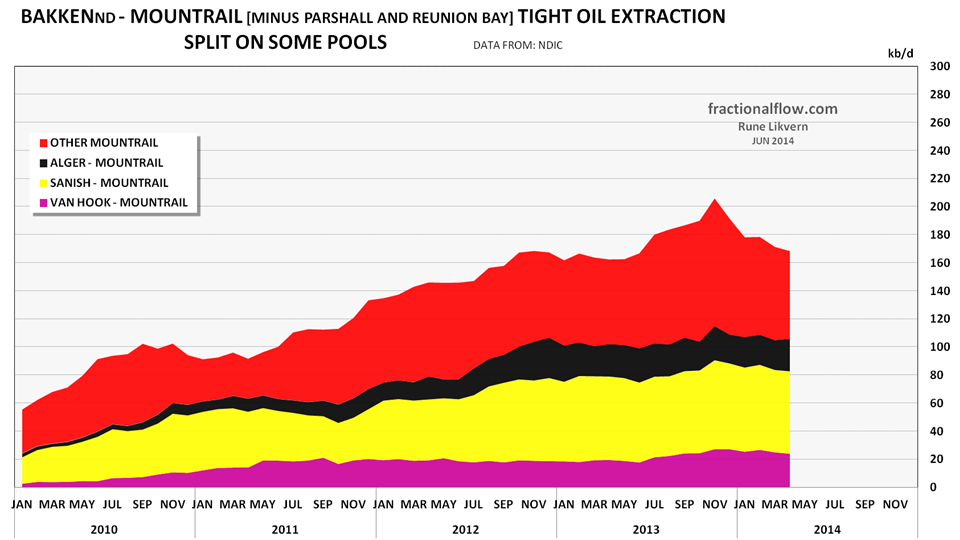
The chart above illustrates clearly that oil extraction in Mountrail is now being sustained from renewed growth in the Parshall and Reunion Bay pools.
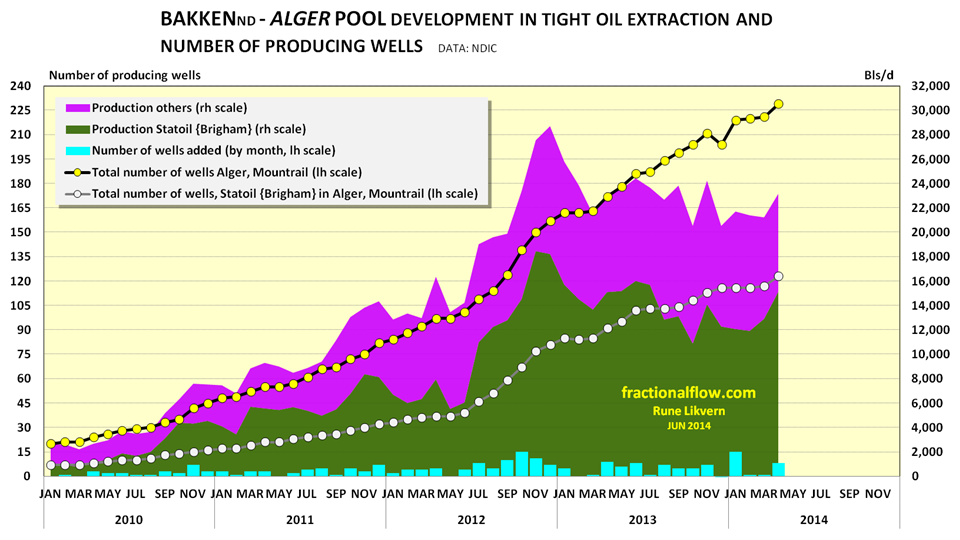
NOTE: The chart does not include wells and their extraction that is on confidential list.
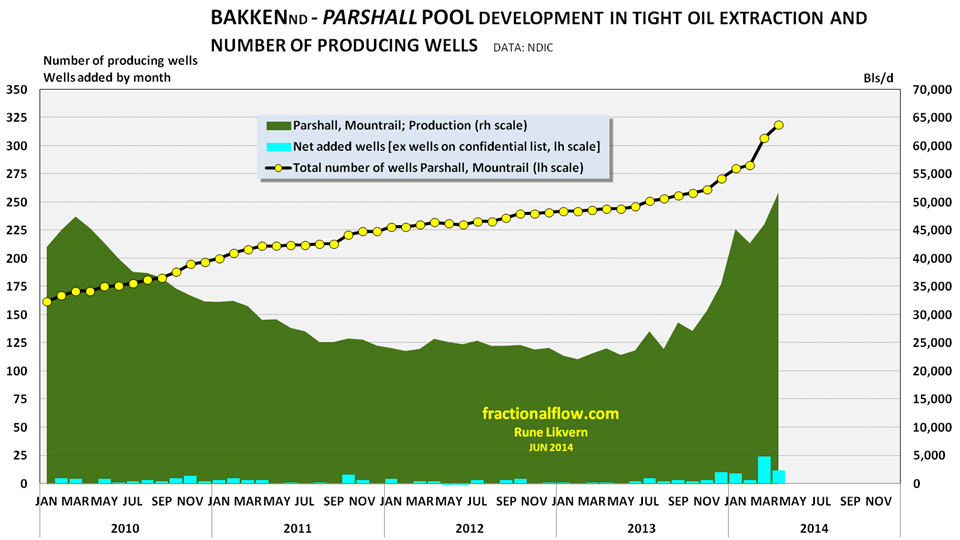
NOTE: The chart does not include wells and their extraction that is on confidential list.
The Parshall pool in Mountrail has seen an astounding revival of growth in oil extracted from a strong growth in additions of producing wells, and as of April 2014 had a new all time high.
DEVELOPMENT IN NUMBER OF IDLE WELLS
![Figure 13: Chart above shows changes in Month over Month (MoM) number of idle wells [blue columns, lh scale and note the axis] for the 4 counties with the biggest extraction and the totals [yellow circles connected by black line, rh scale].](https://runelikvern.com/wp-content/uploads/2020/05/8c3d8-fig-13-changes-in-no-of-idle-wells-and-totals-apr-14.png)
Idle Wells = Number of Wells Capable of Producing – Number of Actual Producing Wells
The chart illustrates the effects of the harsh winter with the steep growth in the number of idle wells that affected total oil extraction in North Dakota. During March 2014 an estimated 72 idle wells relative to February were brought back to producing and contributed to the growth in oil extraction in North Dakota of around 25 kb/d from February to March.
As the total number of idle wells comes down, these will add to the total oil extraction in North Dakota.
MONTANA, ELM COULEE AND ELM COULEE NORTHEAST
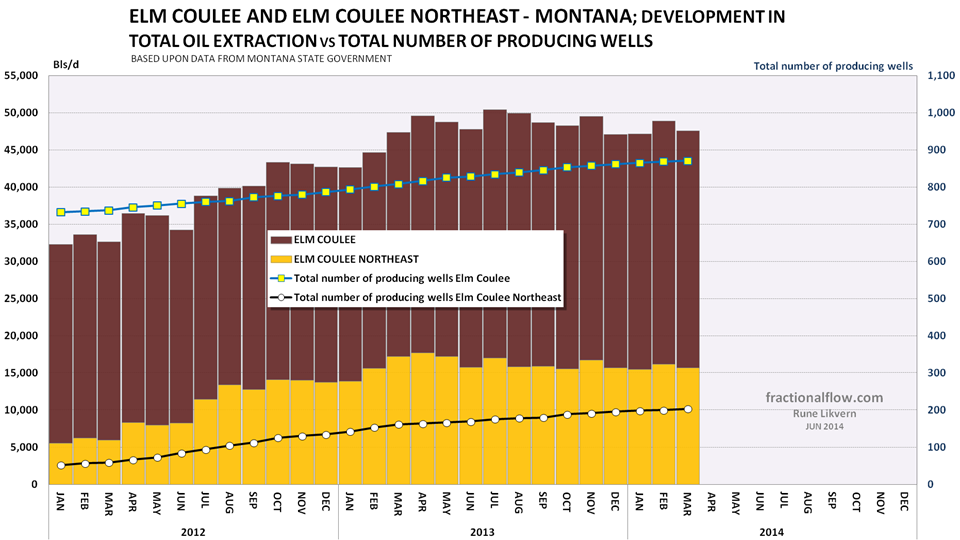
Oil extraction from Elm Coulee and Elm Coulee Northeast from the Bakken/Three Forks formations in Montana (the Bakken formation continues in Montana, west of North Dakota) appears to have been on a plateau since the spring of 2013.
SUMMARY
Given the present rate of additions of producing wells and developments in well productivity it is now expected that LTO extraction from Bakken in North Dakota will reach 1.050 – 1.100 kb/d during 2014.
The growth is now expected to come from continuing additions of wells and idle wells brought back into operation (refer also figure 13).
—
“The stock market is filled with people who know the price of everything, but the value of nothing.”
- Philip Fisher.

One thought on “THE REVIVAL OF MOUNTRAIL’s ”OLD” SWEET SPOTS”
Comments are closed.